Image View Page (Protein Bar View)
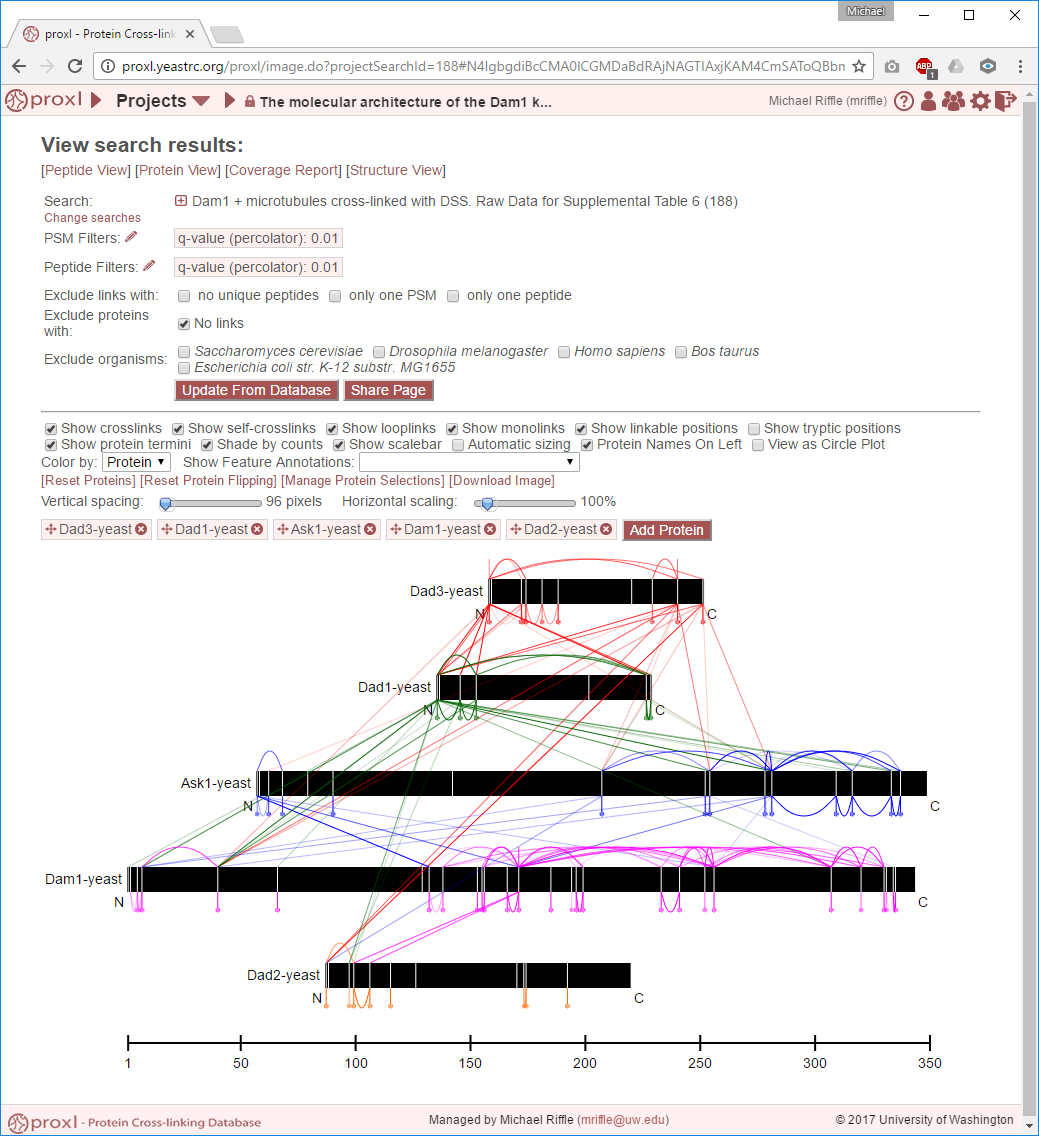
The image viewer displays a SVG rendering of select proteins as bars, the lengths of which are proportional to protein sequence length. The bars are annotated with positions of monolinks, looplinks, crosslinks, and other biological sequence annotations. The viewer is highly interactive and contains many options for customization (see below).
Viewer Basics
Switch to “Circle Plot” View
To switch to the “Circle Plot” view, click the checkbox next to “View as Circle Plot” in the viewer options. See Image View Page (Circle Plot View) for more information.

URL Captures State of Page
The URL of the page is dynamically updated at all times to reflect the complete state of the viewer–including filter parameters, protein bar positions, and all viewer options. As such, the URL may be bookmarked or shared to link to a viewer with the same content and appearance as the current viewer–just copy and paste from the address bar. For complicated visualizations, this is a convenient way to save and share you work. (Note, this link only works for other users who are listed on this project unless public access is enabled.)
Change Searches
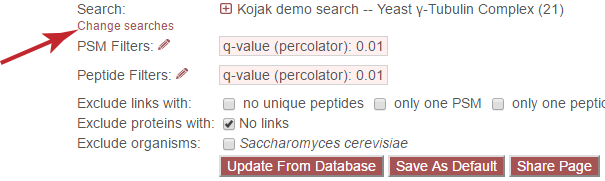
The “Change searches” link allows the user to change which searches are currently being displayed. None of the other options on the page (such as viewer settings) will be changed, only the searches from which data are displayed. Clicking the link causes the following overlay to be displayed:
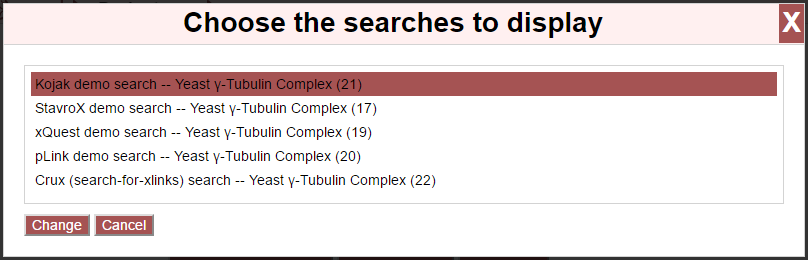
Select or de-select searches by clicking on them in the list. Once done, click “Change” to update the page with the new data or “Cancel” to close the overlay.
Update From Database
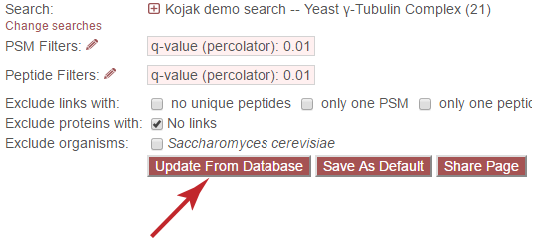
If the user changes any filter parameters–such as PSM/peptide score cutoffs, link type exclusions, protein exclusions, or taxonomic exclusions–this button must be clicked to reflect the new filter choices.
Save as Default
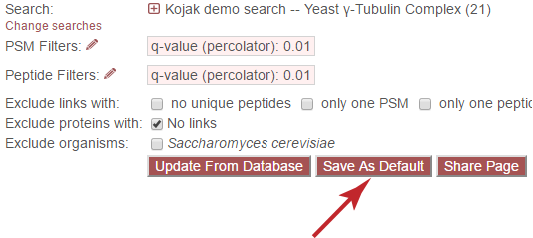
Project owners may click “Save as Default” to save the current URL (see above) as the default view of the “Image View” for this project. This default view will be populated with the same proteins, positions, and viewer options as when the button is clicked. This is a convenient way to share data with collaborators or the public that does not require that they manipulate the image viewer to see the data.
Share Page
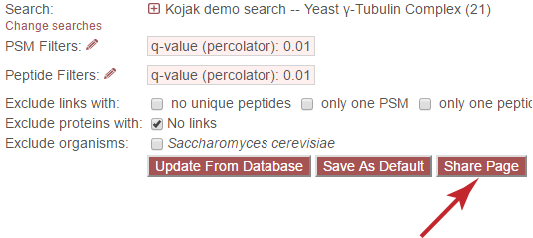
Clicking the “Share Page” button will generate a shortcut URL for viewing the current page, including all viewer settings, filter options, and so forth. The shortened URL will appear in an overlay as:
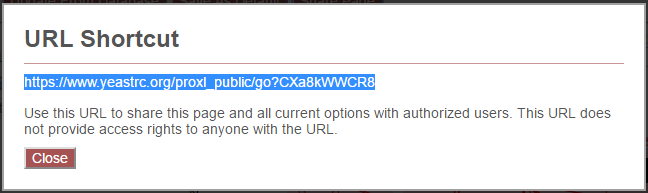
Copying and sharing the highlighted URL will direct users to the view of the page when the URL was generated. Note that this URL does not grant access to the page to any user that would not otherwise have access.
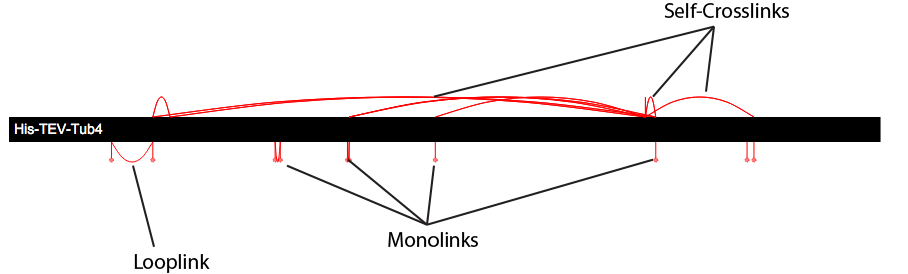
Viewer Display
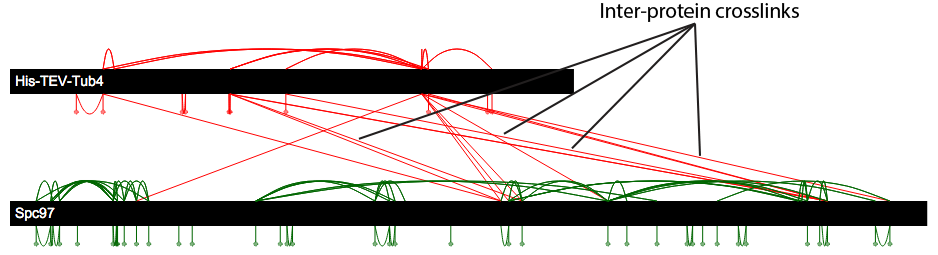
Below is a labeled example of a protein bar in the viewer, with most options disabled. Self-crosslinks, that is crosslinks where both linked peptides map to the same protein, appear as arcs on the top of the protein bar. These are contrasted with looplinks, where a single peptide contains two linked residues, which appear as arcs on the bottom of the protein bar. Monolinks appear as inverted lollipops (a line segment with a ball on the end) on the bottom of protein bars.
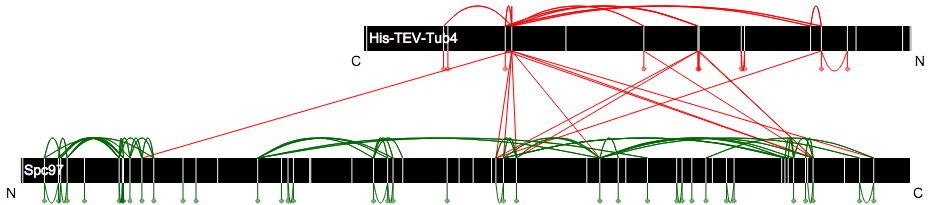
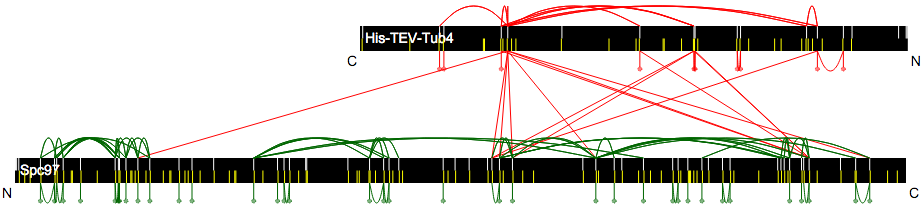
When a second protein is added to the viewer, crosslinks between the two proteins will appear as line segments connecting the two proteins, with the end points of the segments are the respective link positions in the proteins:
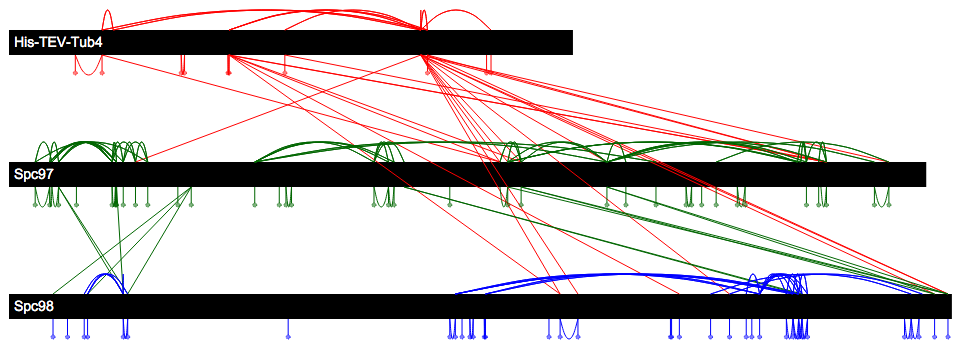
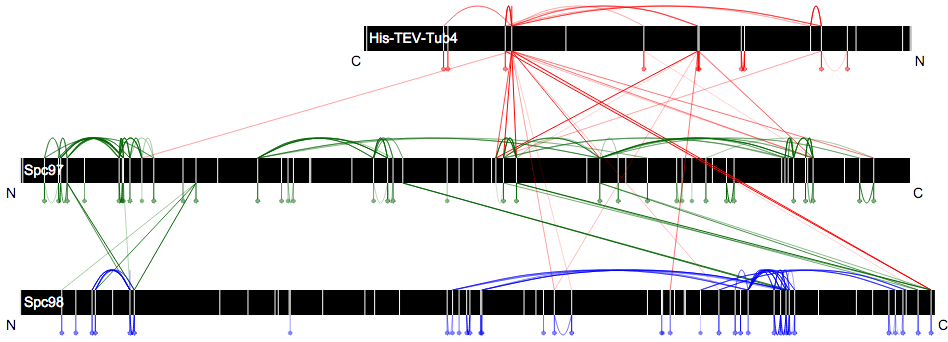
And a third protein:
Coloring
By default, the coloring of the links corresponds to the “originating” protein in the viewer. For example, the first protein is colored red. All of its self-crosslinks, looplinks, and monolinks will be red. And all inter-protein crosslinks originating from this protein will be red. The originating protein of a crosslink will be the protein which appears first in the viewer (from top-down). Similarly, the second protein is colored green. All of its links and originating inter-protein crosslinks will be colored green. This coloring scheme is intended to ease confusion about which links originated at which proteins, farther down the list of proteins.
This coloring scheme can be changed to show in which search(es) the link appears (See Color by search). And, specific proteins in the viewer can be highlighted to only color links involving those proteins (See Highlight Proteins).
Viewer Interaction
Add a Protein
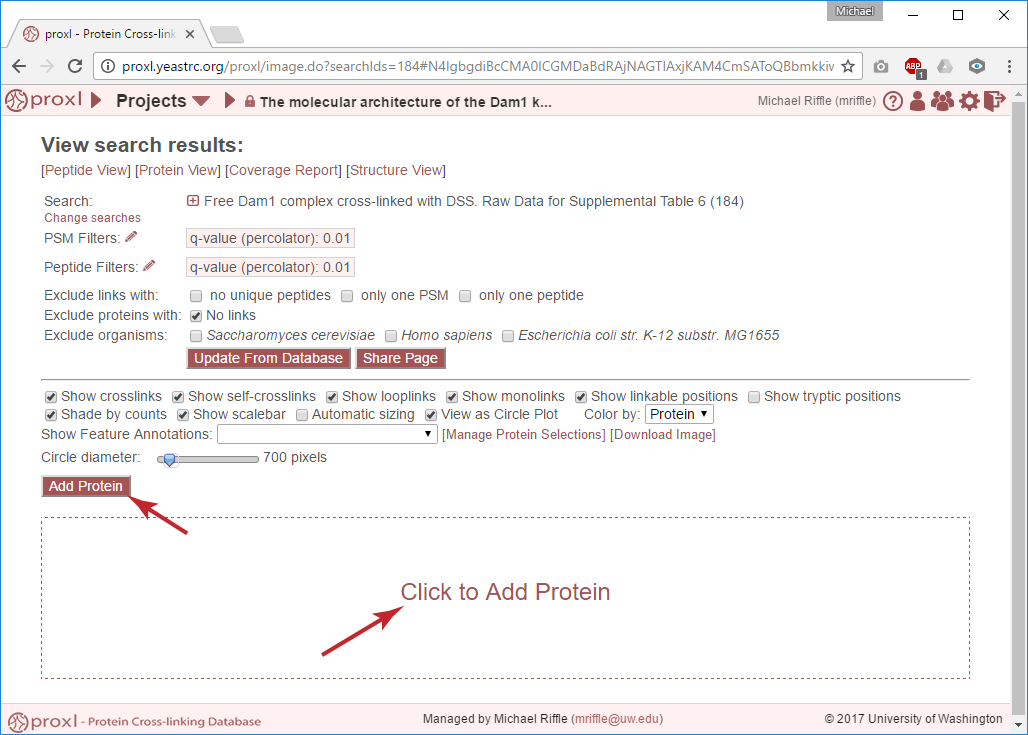
To add a protein to an empty viewer (no proteins visible), click either the “Add Protein” button or the “Click to Add Protein” text in the viewer area:
This will open the “Add Protein(s)” overlay, where one or more proteins may be selected:
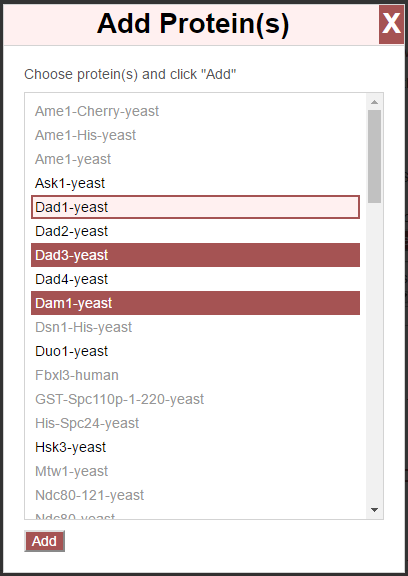
Cick “Add” to add the selected proteins to the viewer. Click anywhere outside the overlay, or on the “X” in the top-right corner, to close the overlay.
To add more proteins to the viewer, click the “Add Protein” button above the viewer.
Remove a Protein
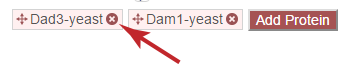
To remove a protein from the viewer, click the small red (X) next to the name of the protein above the image area:
Rearrange Proteins
To rearrange proteins, simply drag and drop the protein in the protein list above the circle to the desired position in the order. The viewer will update automatically.

View Link Summary
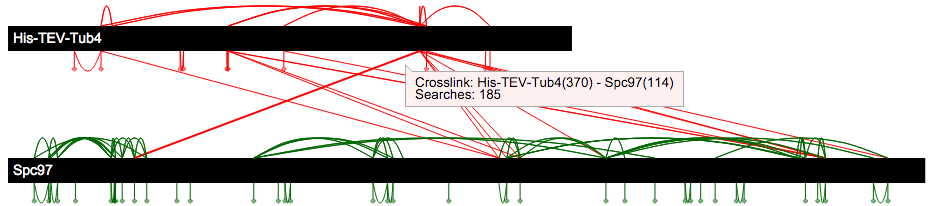
To view summary information about a link, hover your mouse arrow over that link in the viewer. (Or tap, on touch devices.) This may be done for any link type. This will display the link type, protein(s), and position(s).
View Peptides, PSMs, and Spectra
To view listings of the peptides and corresponding PSMs for a link, click on that link in the viewer. This will open an overlay window displaying a table of peptides and PSMs:
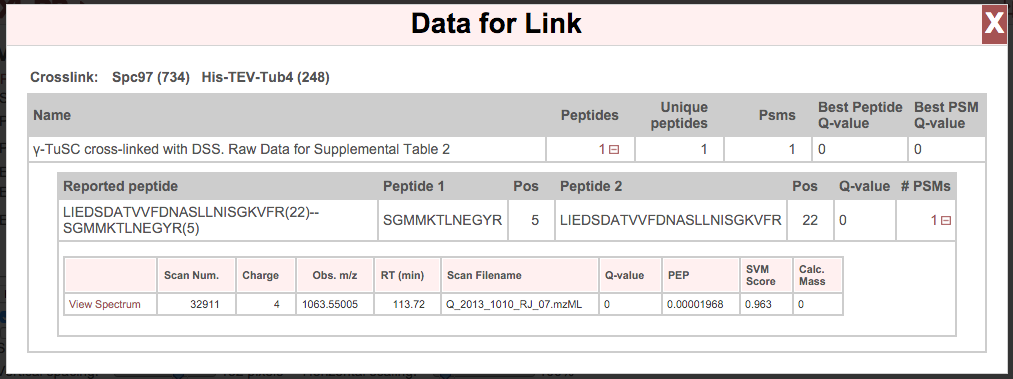
The top-level of this table are rows for each search in which this link was found. If multiple searches have been merged, each search will appear as a row in the table. Each search may be expanded by clicking on that row to view all peptides from that search that led to this link. Each peptide may be expanded by clicking on that row to view all PSMs for that peptide. Each PSM includes a “View Spectrum” link for viewing an annotated spectrum associated with that PSM. For help on our spectrum viewer, see the Spectrum Viewer page. Click the “X” in the top-right corner of the overlay (or click on the page anywhere outside of the overlay) to close the overlay window.
Move Protein Bars
The protein bars may be moved to the left or right by clicking and dragging the bars in the desired direction.
Flip Protein Bars
By default, the protein bars are laid out left-to-right from N-to-C terminus. This orientation may be flipped by double-clicking on the protein bar.
Highlight Proteins
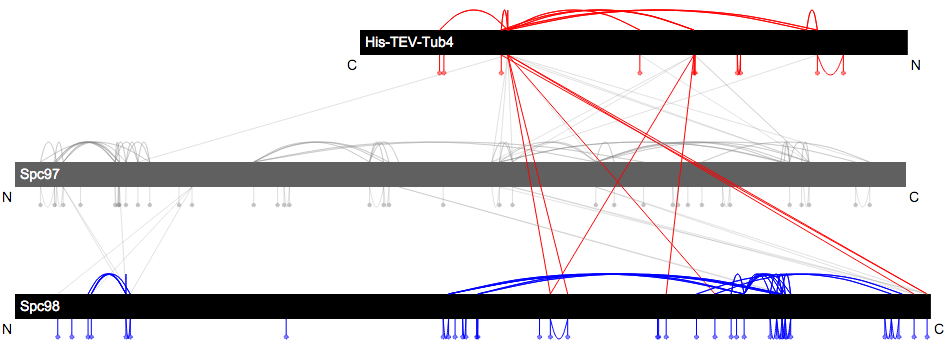
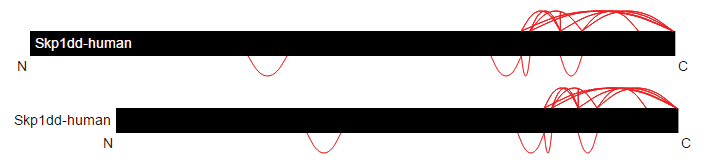
Proteins may be highlighted by clicking on any of the protein bars. This will change the coloring scheme such that only links involving the highlighted protein(s) will be colored, all other links for all other proteins are shaded light gray:
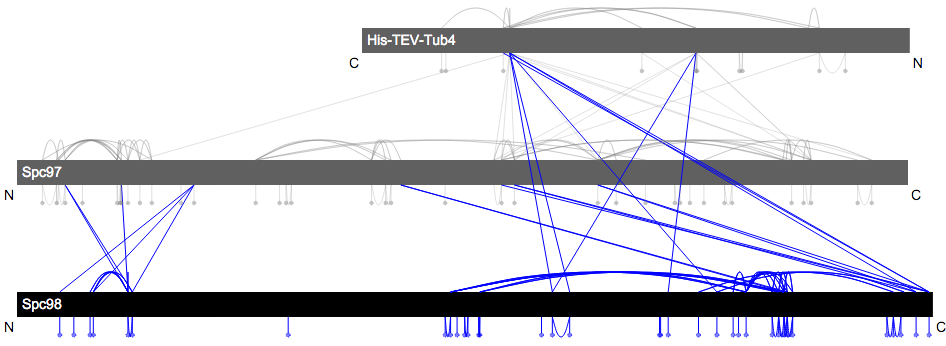
Multiple proteins may be highlighted by holding shift and clicking protein bars:
Remove Highlighting
If a single protein is highlighted, click it to unhighlight it. If multiple proteins are highlighted, hold shift and click a highlighted protein to unhighlight it. If shift is not used, the viewer will highlight only the protein clicked.
Highlight Proteins Regions
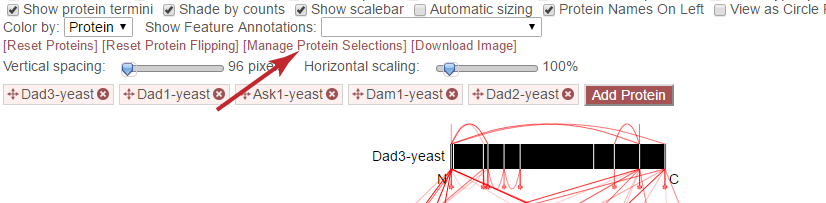
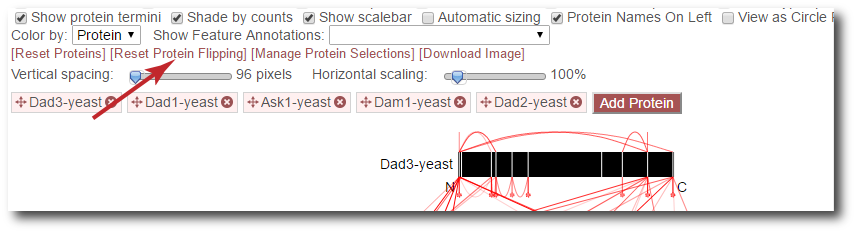
Instead of highlighting entire proteins, it is possible highly only segments of proteins (protein regions). This is done by clicking the “[Manage Protein Selections]” link above the image:
This opens an overlay with an interface for managing which regions of which proteins are highlighted:
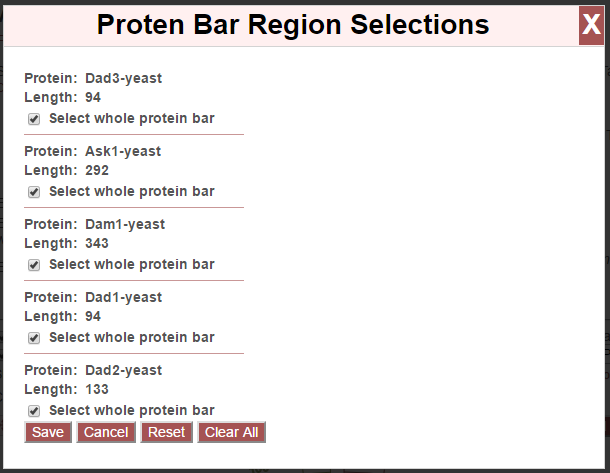
This overlay lists all proteins visible in the viewer and which regions are currently highlighted for each one. By default, all proteins are visible in their entirety, so the “Select whole protein bar” option is checked for all of them. When this checkbox is checked, that protein is highlighted in its entirety and no sub-regions may be selected.
To select sub-regions in a protein to highlight, uncheck the “Select whole protein bar” option:
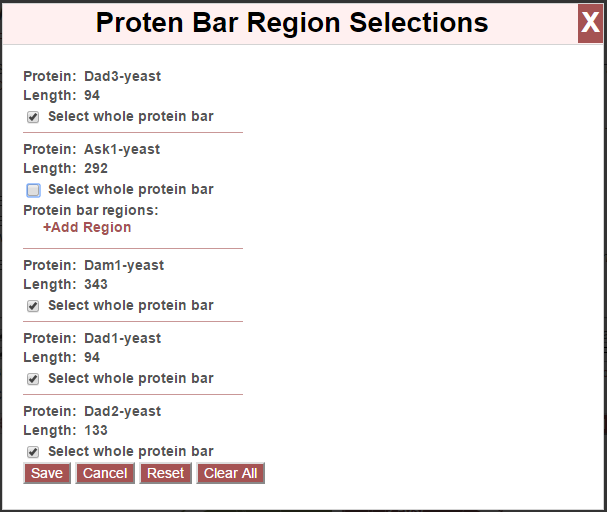
Click “+Add Region” to define the start and end positions for a region to highlight in that protein. This option may be used multiple times per protein to define multiple regions. Click the red “x” next to a region to remove it. Unchecking “Select whole protein bar” and not defining regions unhighlights that entire protein:
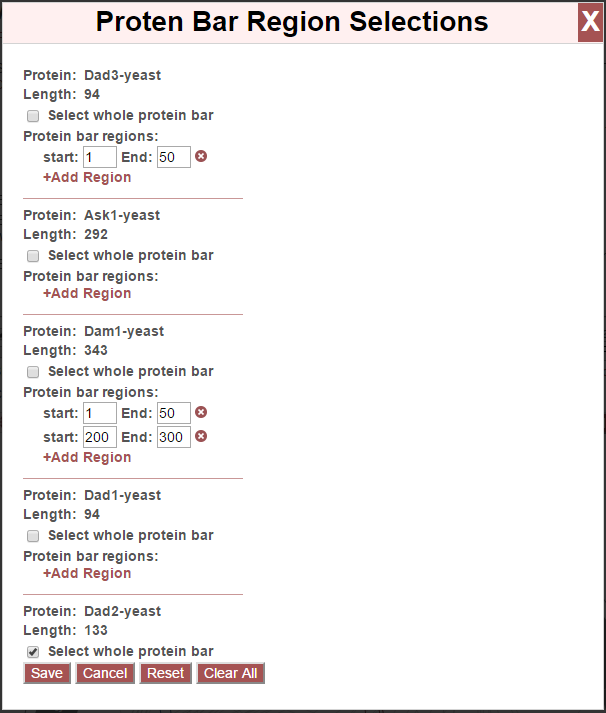
Click “Save” to save these settings and view the image with these defined regions. Click “Cancel” to make no changes and close overlay, “Reset” to reset regions to those visible in the image (without closing overlay), and “Clear All” to set to defaults (all proteins visible).
Clicking “Save” gives us:
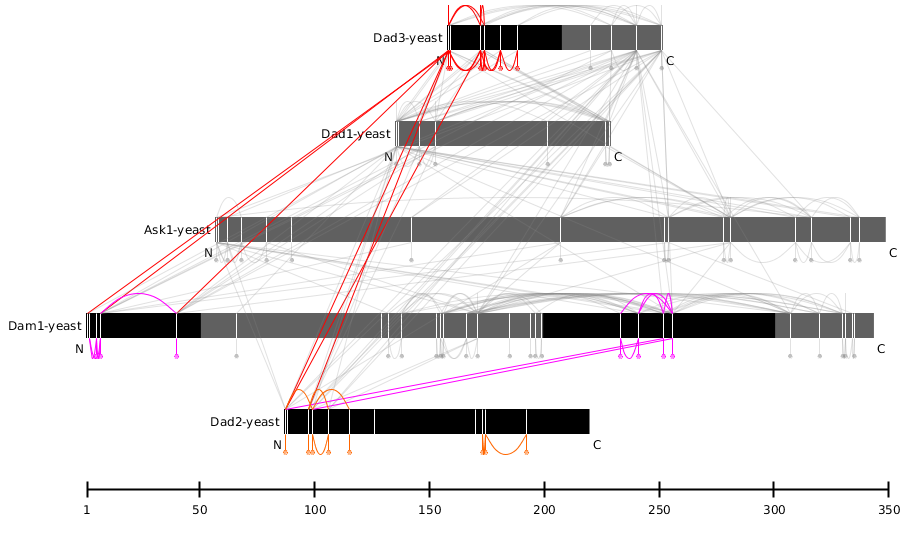
Only links within and between the defined regions are colored. The reset are greyed-out.
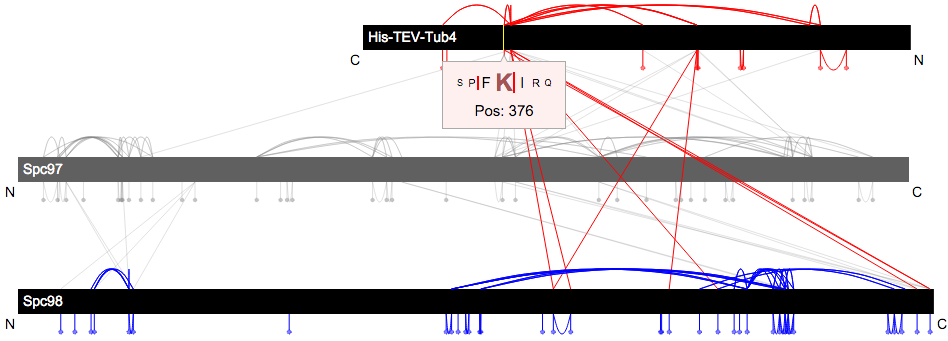
Local Sequence Information
Local sequence information in the protein bars may be viewed by hovering the mouse cursor over the protein bar. A tooltip will appear that shows the amino acid position number, the amino acid at that position, and neighboring amino acids. Amino acids that linkable with the crosslinker(s) used in the experiment(s) will be bolded and red. Vertical bars indicate sites that are cleavable by trypsin. This tooltip will slide and dynamically update along with the mouse cursor as it is moved along the protein bar.
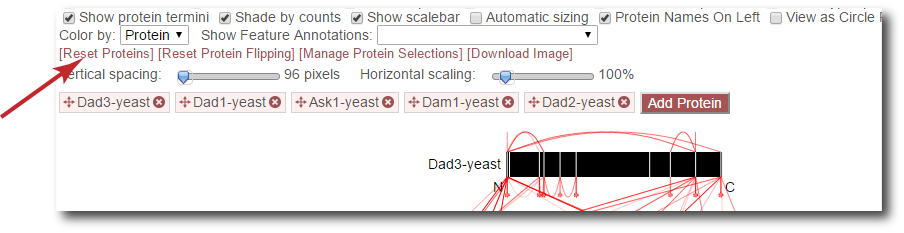
Reset Proteins
Reset the positioning of all protein bars so that left edges are aligned to left of viewer.
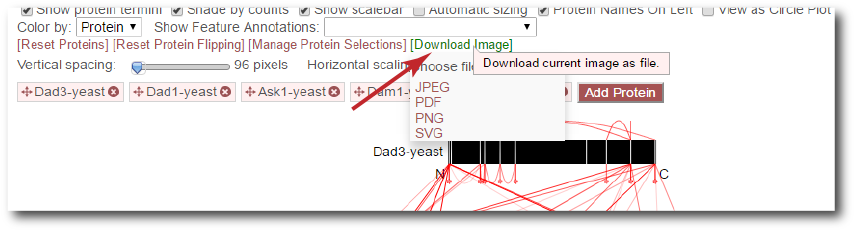
Download Image
Mouse over the “[Download Image]” link to see image download options. Click on the format of choice to initiate a download of the image.
Viewer Options
Show crosslinks
Toggle the showing of inter-protein crosslinks.
Show self-crosslinks
Toggle the showing of intra-protein crosslinks.
Show looplinks
Toggle the showing of looplinks.
Show monolinks
Toggle the showing of monolinks.
Show linkable positions
Toggle the showing of which positions in the protein are linkable by the crosslinker(s) used in the experiment. The linkable positions are noted by white lines in the protein bar.
Show show tryptic positions
Toggle the showing of which positions in the protein are cleavable by trypsin, an enzyme commonly used to digest proteins in bottom-up proteomics experiments. The cleavable positions are noted by yellow lines in the protein bar.
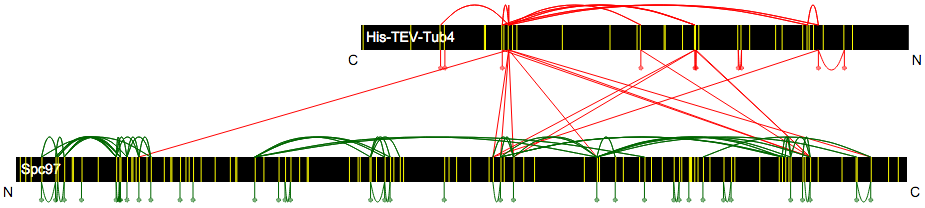
If both linkable and tryptic positions are being displayed, each type is displayed by a half-height line to remove ambiguity caused by overlapping linkable and tryptic positions. Linkable sites are shown in white on the top-half of the protein bar, and tryptic positions in yellow on the bottom half.
Show protein termini
Toggles the labelling of the N and C termini to the lower left and right of the protein bars.
Shade by counts
If enabled, the opacity (transparency) of links reflects the number of PSMs found (or spectrum count) for the shown link. The shading scales from 1 PSM (minimum opacity, most transparent) to 10 PSMs (maximum opacity). Any link having 10 or more PSMs will have the maximum opacity.
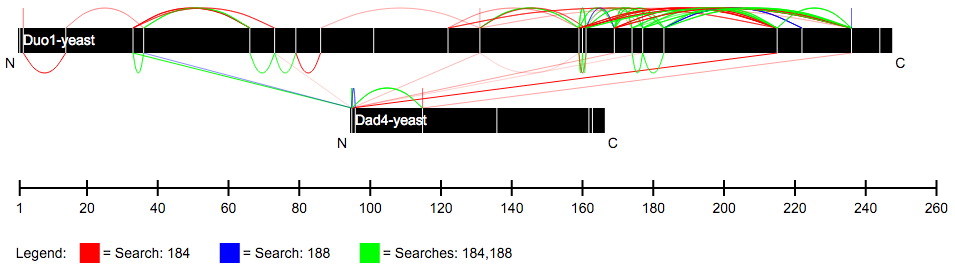
Color by search
When merging multiple searches, this option changes the coloring scheme so that all links are colored by which search (or searches) they were found in at the given cutoffs. Each search is assigned a color, and each combination of searches are assigned other, distinct colors. It is possible to ascertain from the color in which search, or combination of searches, the individual link was found. A legend is provided beaneath the graphic. This functionality is limited to a maximum of three searches.
Show scalebar
Toggle the display of the scale bar on and off.
Automatic sizing
The viewer automatically determines a single horizontal scale for pixels/residue for all protein bars based on the length of the longest protein and the width of the browser window–such that the longest protein stretches the entire width of the window. This scaling is dynamically recalculated and redrawn as the width of the browser window is changed or as longer proteins are added to the viewer. Additionally, the viewer employs a default vertical distance between the protein bars.
These defaults may be disabled and manually altered by disabling this option. Disabling this option presents the two sliders below:

Vertical spacing
This slider adjusts the distance between the vertical bars, slide right to increase the distance.
Horizontal scaling
This slider adjusts the the number of pixels per residue, as a percentage of the default. 50% means the bars are scaled to be one-half as wide as they are by default. 400% means the bars are 4 times as wide. Slide left to decrease the width, slide right to increase the width.
Protein Names On Left
By default, protein names are placed within the protein bar, on the left side. This option will place the protein names outside and to the left of the protein bars.
Show Feature Annotations
This option allows for the display of protein sequence feature annotations of various on the protein bars. To select a type of feature annotation, click the pull-down menu next to “Show Feature Annotations” and select a type:
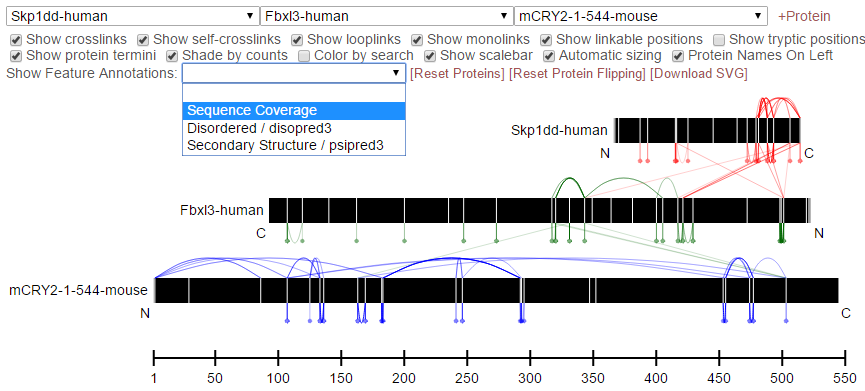
This will retrieve the necessary data from the server and display the respective annotation as a shaded region on the protein bars:
The types of feature annotations currently supported are:
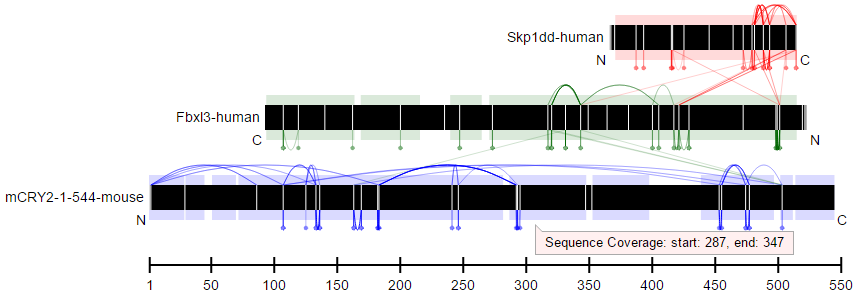
Sequence Coverage
Sequence coverage shows which regions of the protein’s sequence are covered by peptides of any type from the search(es) that meet the filtering criteria. An example of viewing the sequence coverage is shown above. The regions may be moused over to view exact start and stop residues.
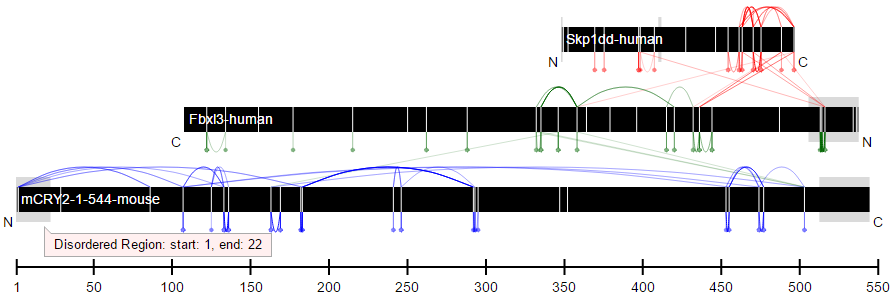
Predicted Disordered Regions
Selecting this option annotates the protein bars to show predicted disordered regions according to the DISOPRED3 algorithm. The regions may be moused over to view exact start and stop residues. This feature requires that PAWS be available, see: Feature Annotations and PAWS.
Predicted Secondary Structure
Selecting this option annotates the protein bars to show predictions for secondary structure according to the PSIPRED 3 algorithm. The regions may be moused over to view exact start and stop residues. This feature requires that PAWS be available, see: Feature Annotations and PAWS.
Feature Annotations and PAWS
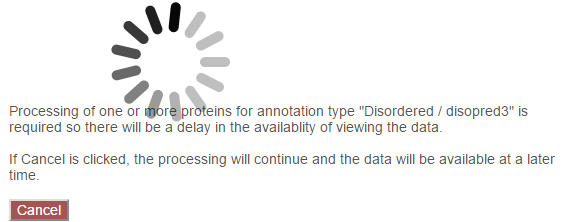
Disordered regions and secondary structure require a separate, optional web application be installed by the site administrator that we have called PAWS, or Protein Annotation Web Services. Requests for these types of sequence annotations make a request to the PAWS service for information about the respective sequence. If available, that information is sent by PAWS to proxl and that information is shown. If not available, PAWS will initiate the running of DISOPRED3 or PSIPRED3 on the sequence, store the results in a database (for future use), and respond to proxl with the data.
As a consequence, if the sequence annotations for the requested sequence has not yet been run, there may be a delay before the data are shown in proxl. The user as the option of waiting for the data to be returned, or canceling and performing other actions. (Note: if canceled, the data are still processed and will be available on a subsequent request.)
For more information about PAWS, please see PAWS Guide.
Filter Data
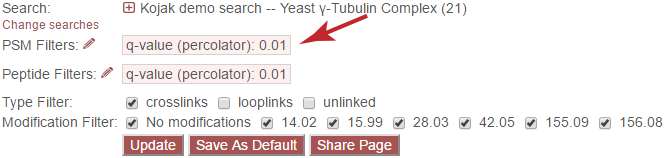
The data presented in the viewer may be filtered using the form at the top of the page. The filtering options are:
PSM Filters
The filters to apply at the PSM level. Only results which have at least one PSM that meets all of the selected critiera will be listed. When listing PSMs associated with peptides, only PSMs that meet all of the selected critiera will be listed.
To change the PSM-level filters, first click the pencil icon next to “PSM Filters”:
This opens an overlay with the containing the possible score types to use as PSM filters for this search. To change the cutoff values to be used for any of these score types, enter the value next to the score type. proxl will correctly handle scores for which larger values are more significant or scores for which smaller values are more signiciant.
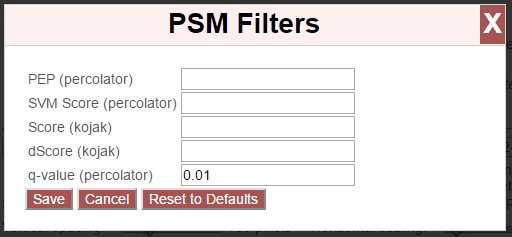
To save the new values to the page, click the “Save” button. To cancel, click “Cancel”.
The “Reset to Defaults” button will reset the cutoff values to the defaults specified by the proxl XML file uploaded to the database. This typically represents the suggested cutoffs by the author of the respective search program.
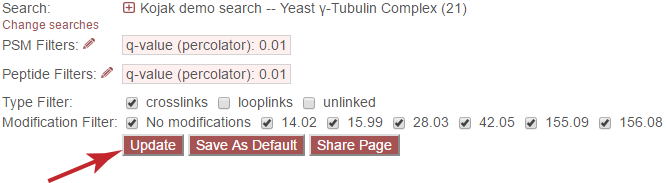
Important: It is necessary to update the data on the page after changing filter cutoff values. After clicking the “Save” button, you must click the “Update From Database” button on the page to apply any new PSM- or peptide-level filters.
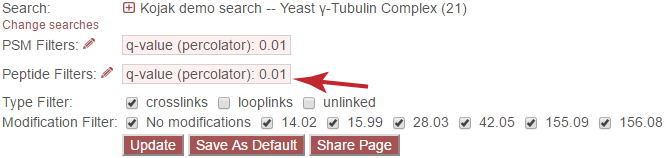
Peptide Filters
The filters to apply at the peptide level. Only results which have at least one peptide that meets all of the selected critiera will be listed.
To change the peptide-level filters, first click the pencil icon next to “Peptide Filters”:
This opens an overlay with the containing the possible score types to use as peptide-level filters for this search. To change the cutoff values to be used for any of these score types, enter the value next to the score type. proxl will correctly handle scores for which larger values are more significant or scores for which smaller values are more signiciant.
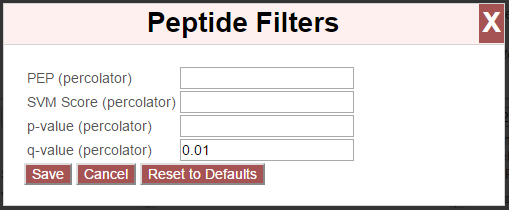
To save the new values to the page, click the “Save” button. To cancel, click “Cancel”.
The “Reset to Defaults” button will reset the cutoff values to the defaults specified by the proxl XML file uploaded to the database. This typically represents the suggested cutoffs by the author of the respective search program.
Important: It is necessary to update the data on the page after changing filter cutoff values. After clicking the “Save” button, you must click the “Update From Database” button on the page to apply any new PSM- or peptide-level filters.
Exclude links with
Peptides with any of the checked attributes will not be shown. The attributes are:
- no unique peptides - If the link (crosslink, looplink, or monolink) was exclusively identified by peptides that also map to othe proteins
- only one PSM - If a given link was identified by a single PSM
- only one peptide - If a given link was identifed by a single peptide, where a peptide is the combination of sequence, linked positions, and modifications
Exclude proteins with
This option limits which proteins will appear in the pull-down menu for adding proteins to the viewer (see below). Proteins that contain any of the checked options will not appear. For example, checking ‘No links’ prevents proteins that do not contain crosslinks, looplinks, or monolinks from appearing.
Exclude organisms
This options limits which proteins will appear in the pull-down menu for adding proteins. No proteins from any of the checked organisms will appear.