Merged Protein View Page
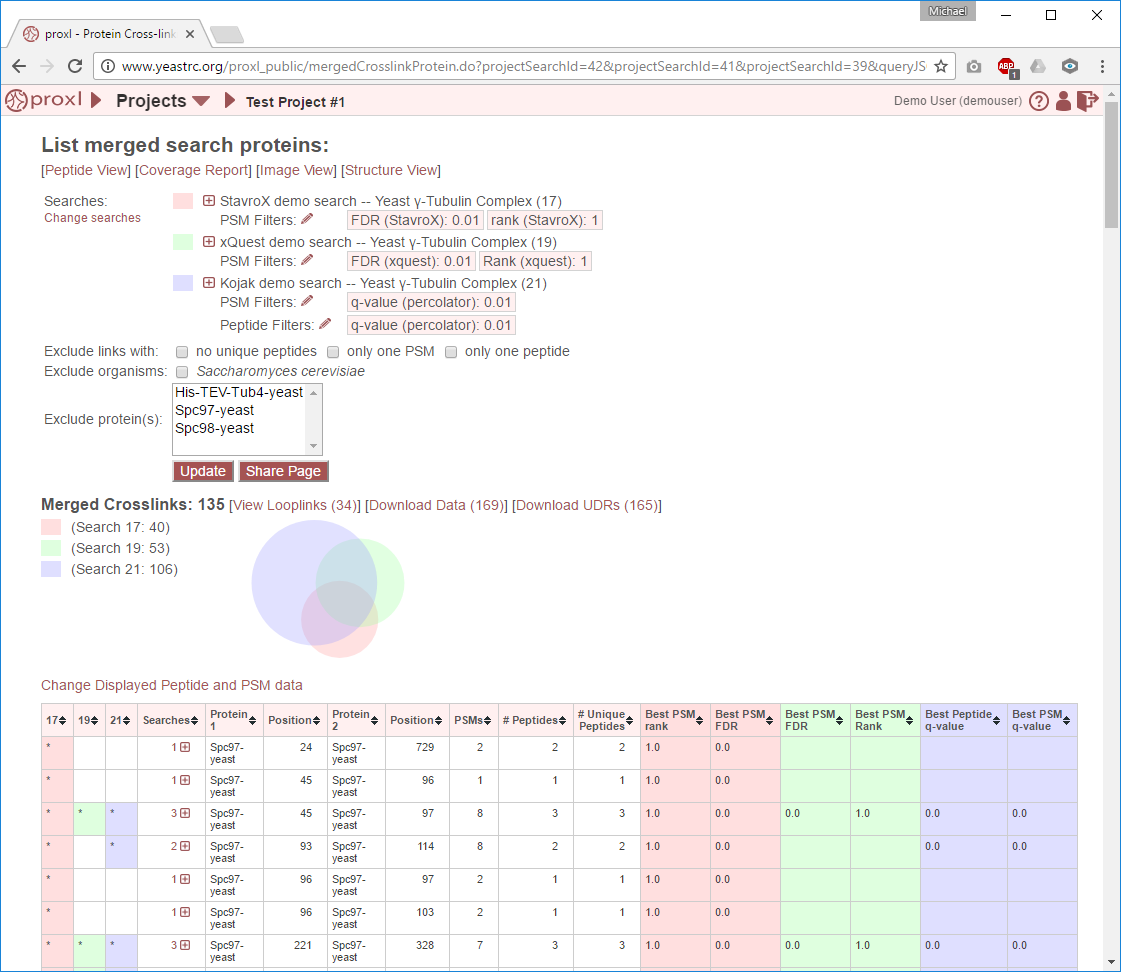
To reach this page, select multiple searches on the project page and click “View Merged Proteins”. (See Project Overview Page.) This page combines and collates the data from multiple searches and presents the results as an interactive table. The searches do not need to be from the same software pipeline. For example, different versions of the same program may be compared, or the results from entirely different programs (e.g., Kojak and XQuest) may be compared. Currently, the total number of merged searches must be 2 or 3 and must be from the same project. For the protein view page seen when viewing a single search, see Proteins View Page.
This page is designed to present the data at the protein level, or the UDR level. That is to say that rows in the table represent distinct proteins linked at distinct positions. Rows in the table may be clicked on to view the data at the individual search level, and each of those searches may be expanded to view the underlying proteins, PSMs, and spectra.
Note: If any identified peptides map to multiple proteins, those proteins are listed here as separate rows. For example if peptide 1 is linked to peptide 2, and peptide 1 maps to protein A and peptide 2 maps to proteins B and C, rows will be present for A-B and A-C. This may dramatically increase the number of reported crosslinks if your protein database is redundant in terms of homologous proteins or proteoforms or if small peptides are mapping to many proteins. The filtering options described below are meant to help eliminate this redundancy in reported proteins.
General Options
Change Searches
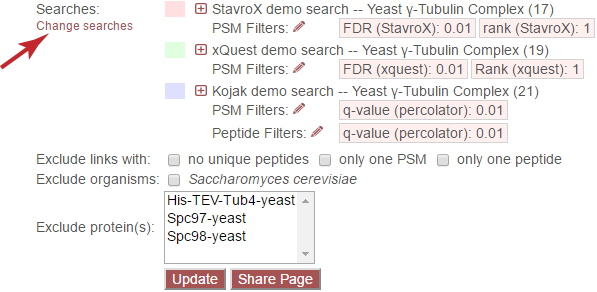
The “Change searches” link allows the user to change which searches are currently being displayed. Clicking the link causes the following overlay to be displayed:
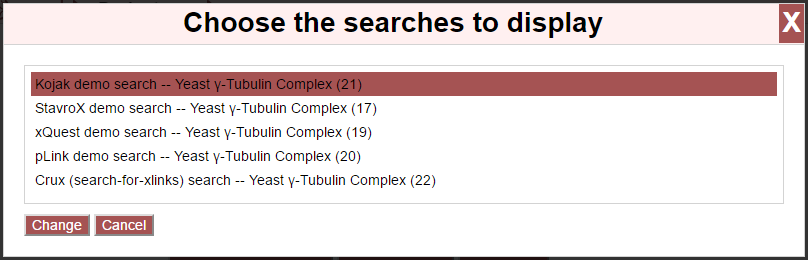
Select or de-select searches by clicking on them in the list. Once done, click “Change” to update the page with the new data or “Cancel” to close the overlay.
Update From Database
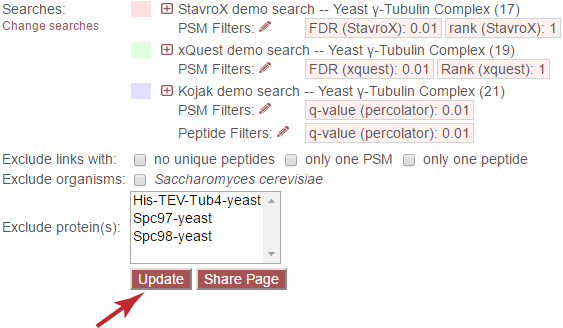
If the user changes any filter parameters–such as PSM/peptide score cutoffs–this button must be clicked to reflect the new filter choices.
Share Page
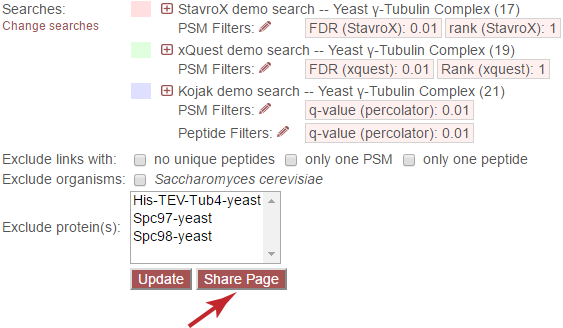
Clicking the “Share Page” button will generate a shortcut URL for viewing the current page. The shortened URL will appear in an overlay as:
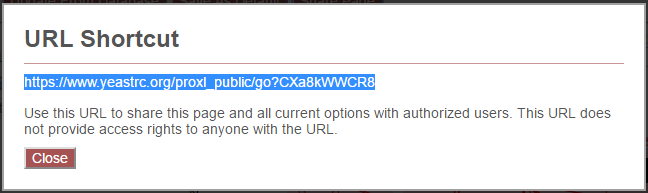
Copying and sharing the highlighted URL will direct users to the view of the page when the URL was generated. Note that this URL does not grant access to the page to any user that would not otherwise have access.
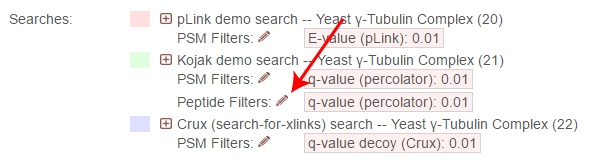
Search List
The list of merged searches is presented below the top navigation. Each search is shown next to its assigned color for the page, and the color referencing this search is retained in the Euler diagram and in the peptide table. Clicking the [+] icon will expand that search to view details:
Search Details
The “Path” is the location on disk from which the data were imported. The “Linker” is the name of the crossinker used in the experiment. “Search Program(s)” is the name and version number of the PSM search software used. “Upload date” is the date the data were uploaded into proxl. “FASTA file” is the name of the FASTA file used to perform the PSM search.
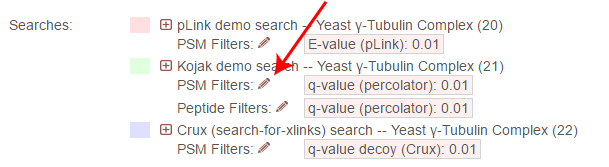
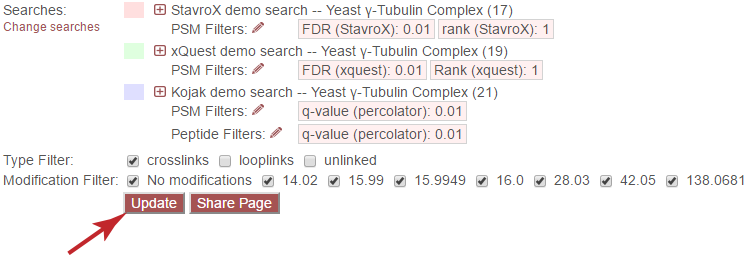
Search Filter
Each search is filtered separately, according to its own native score types. To change the filters for each search, click the pencil icon next to “PSM Filters:” or “Peptide Filters:” next to each search.
PSM Filters
The filters to apply at the PSM level. Only results which have at least one PSM that meets all of the selected critiera will be listed. When listing PSMs associated with peptides, only PSMs that meet all of the selected critiera will be listed.
To change the PSM-level filters, first click the pencil icon next to “PSM Filters” or the filter tag:
This opens an overlay with the containing the possible score types to use as PSM filters for this search. To change the cutoff values to be used for any of these score types, enter the value next to the score type. proxl will correctly handle scores for which larger values are more significant or scores for which smaller values are more signiciant.
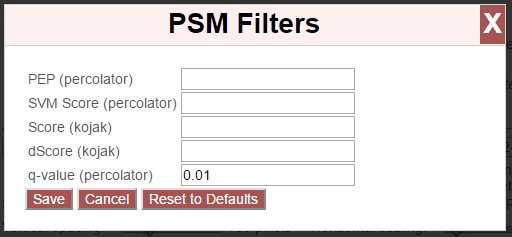
To save the new values to the page, click the “Save” button. To cancel, click “Cancel”.
The “Reset to Defaults” button will reset the cutoff values to the defaults specified by the proxl XML file uploaded to the database. This typically represents the suggested cutoffs by the author of the respective search program.
Important: It is necessary to update the data on the page after changing filter cutoff values. After clicking the “Save” button, you must click the “Update” button on the page to apply any new PSM- or peptide-level filters.
Peptide Filters
Some search algorithms, such as Percolator, provide statistics at the peptide level that may be used for filtering. If applicable, peptide-level filtering options may be set here. Only results which have at least one peptide that meets all of the selected critiera will be listed.
To change the peptide-level filters, first click the pencil icon next to “Peptide Filters”:
This opens an overlay with the containing the possible score types to use as peptide-level filters for this search. To change the cutoff values to be used for any of these score types, enter the value next to the score type. proxl will correctly handle scores for which larger values are more significant or scores for which smaller values are more signiciant.
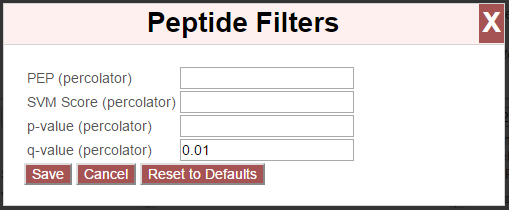
To save the new values to the page, click the “Save” button. To cancel, click “Cancel”.
The “Reset to Defaults” button will reset the cutoff values to the defaults specified by the proxl XML file uploaded to the database. This typically represents the suggested cutoffs by the author of the respective search program.
Important: It is necessary to update the data on the page after changing filter cutoff values. After clicking the “Save” button, you must click the “Update” button on the page to apply any new PSM- or peptide-level filters.
Filter Data
The data presented may be filtered according to the following criteria. Note: Only crosslinks or looplinks that meet ALL the filter criteria are shown.
Exclude links with
Crosslinks or looplinks that have any of the checked attributes will be excluded. The attributes are:
- no unique peptides - If all peptides that ID either one of the crosslinked proteins also map to another protein
- only one PSM - If a given crosslink or looplink was identified by a single PSM
- only one peptide - If a given crosslink or looplink was identifed by a single peptide, where a peptide is the combination of sequence, linked positions, and modifications
Exclude organisms
Any links containing a protein that maps to any of the checked organisms will be excluded. The list of organisms presented was gathered by the proteins found in the search. Useful for filtering out groups of contaminant proteins.
Exclude protein(s)
Any links containing a any of the selected proteins will be excluded. Multiple proteins may be selected or unselected using control-click (command-click on the mac) or shift-click. Useful for filtering out individual contaminant proteins.
Update
Important: It is necessary to update the data on the page after changing filter cutoff values. After clicking the “Save” button, you must click the “Update” button on the page to apply any new PSM- or peptide-level filters.
Euler diagram
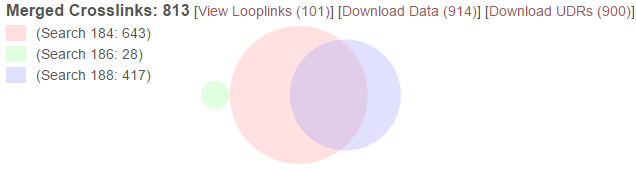
The Euler diagram (similar to a Venn diagram) provides a graphical depiction of the relative sizes and overlap between the proteins/UDRs found in the merged searches. The colors in the diagram match the colors used for the search list above. The search list is provided to the left of the diagram with their associated colors as a legend. The labels for each color include the search ID number and the number of crosslink or looplink UDRs found in each of the merged searches. The total number of crosslink or looplink UDRs resulting from the merge is presented in the header above the legend next to “Merged Crosslinks” or “Merged Looplinks”.
View Looplinks
By default, the table shows crosslinks. To switch to looplinks, click the [View Looplinks] link at the top of the table. To view crosslinks again, click the [View Crosslinks] link that appears at the top of the table.
Download Data
All crosslinks and looplinks that meet the current filtering criteria may be downloaded as tab-delimited text by cliking the [Download Data (#)] link above the table. # indicates the number of rows in the table.
Download UDRs
UDR stands for “unique distance restraint”, which takes its name from 3D modelling terminology. A UDR, in proxl, is any specific position in a protein linked to a specific position in another protein, whether it is a crosslink or a looplink. The [Download UDRs (#)] link downloads a non-redundant tab-delimited text table of these UDRs consolidated from the crosslinks and looplinks. The # is the number of UDRs.
Table Description
The table presents columns describing the proteins/UDRs and indicates in which of the merged searches they were found. There is one row per UDR. Each row in the table may be clicked on to expand and view the protein-level data by search. Each of these searches may then be clicked on to view peptides, PSMs and spectra from those searches.
Columns
The columns are described below. Note that all column headers may be clicked to toggle between ascending and descending sorting of that column. Holding the shift key while clicking column headers allow sorting on multiple columns.
Search Columns
The first 1-3 columns will be labeled with search ID numbers as headers, and provide an indication for whether or not the UDR in that row was found in that search. If found in that search, the cell for this search in this row will be shaded the same color associated with that search in the Euler diagram and search list at the top of the page. The column will also contain an asterisk. If not found, this cell is empty.
Searches
The number of the merged searches that contain this UDR. The [+] icon indicates that the row may be clicked on to be expanded to show underlying searches in which this UDR was found, the peptides and their statistics, and PSMs and associated spectra.
Protein 1 and 2 (Crosslink-only)
In the case of crosslinks, these are the crosslinked proteins
Position (Crosslink-only)
This is the crosslinked position in the respective proteins, where the first residue is counted as position 1.
Protein (Looplink-only)
In the case of looplinks, this is the looplinked protein
Position 1 and 2 (Looplink-only)
In looplinked proteins, these are the positions in the protein that are linked.
PSMs
The total number of PSMs (peptide spectrum matches) meeting the cutoff that identified either crosslinked (crosslink view) or looplinked (looplink view) peptides that mapped to the reported proteins and positions.
# Peptides
The total number of identified crosslinked (crosslink view) or looplinked (looplink view) peptides meeting the filtering critiera that mapped to the reported proteins and positions.
Note: The individual peptides may be viewed by clicking a row in the table to view a table of peptides. Rows in that peptide table may also be viewed to view the underlying PSMs and view spectra.
# Unique Peptides
Of the # of peptides, the total number that uniquely mapped to this protein pair (crosslink view) or protein (looplink view).
Best PSM- and Peptide-level Scores
Separate columns, color-coded for each search, display the best PSM- and peptide-level scores currently being used to filter the data from each search.
View Search-level summary
Clicking on a row for a UDR will expand that row and present search-level data for that UDR–such as in which search(es) it was found, how many peptides were found for it, how many PSMs, and PSM- and peptide-level scores. Clicking on the search rows will expand to reveal underlying peptides.
View Peptides
All peptides that meet the filtering critiera that were mapped to a protein-level crosslink or looplink may be seen by clicking on the respective row in the search-level summary. Additionally, all rows of this peptide table may clicked to view all PSMs associated with that peptide identification.
Columns
The peptides appear in a table with the following columns:
Reported peptide
The peptide identificaton as it was reported by the respective search program.
Peptide 1 and 2 (Crosslink-only)
The sequences of the two crosslinked peptides.
Pos (Crosslink-only)
The positions in the respective peptides that were crosslinked (starting at 1).
Peptide (Looplink-only)
The sequence of the looplinked peptide.
Pos 1 and 2 (Looplink-only)
The positions in the peptide that were looplinked.
Peptide Scores
The peptide-level scores for this peptide from this search.
# PSMs
The number of PSMs that meet the cutoff criteria that identified this peptide.
Best PSM-level Scores
The best PSM-level scores for this search for this peptide for the PSM-level scores currently being used as filtering criteria.
View PSMs
All PSMs meeting the current filtering criteria may be viewed for a peptide by clicking on a peptide’s row.
Columns
The PSMs appear in a table with the following columns:
Scan Num.
The scan number from the spectral file (e.g., mzML file)
Charge
The predicted charge state of the precursor ion.
Obs. m/z
The observed m/z of the precursor ion.
RT (min)
The retention time in minutes.
Scan Filename
The filename of the scan file.
Scores
Each PSM-level score for this PSM from this search are displayed in separate columns.
View Spectra
The annotated mass spectrum may be viewed for any PSM by clicking the “View Spectrum” link. For help on our spectrum viewer, see the Spectrum Viewer page.
Sort Data
All column headers may be clicked to toggle between ascending and descending sorting of that column. Holding the shift key while clicking column headers allow sorting on multiple columns.