Spectrum Viewer
Proxl uses a version of the Lorikeet spectrum viewer that has been modified to support crosslinked and looplinked spectra. Lorikeet is a pure-HTML and Javascript viewer that requires no 3rd party plugins to use. (Source code of the customized version of Lorikeet may be found here.) Some knowledge of interpreting tandem mass spectra is assumed in this document.
Overview
Below is a labeled screen shot of the Lorikeet showing the various panels that make up the basic spectrum viewer. In this example, Lorikeet is presenting an unlinked spectrum (not a crosslink or looplink) that has a monolink on the first residue.
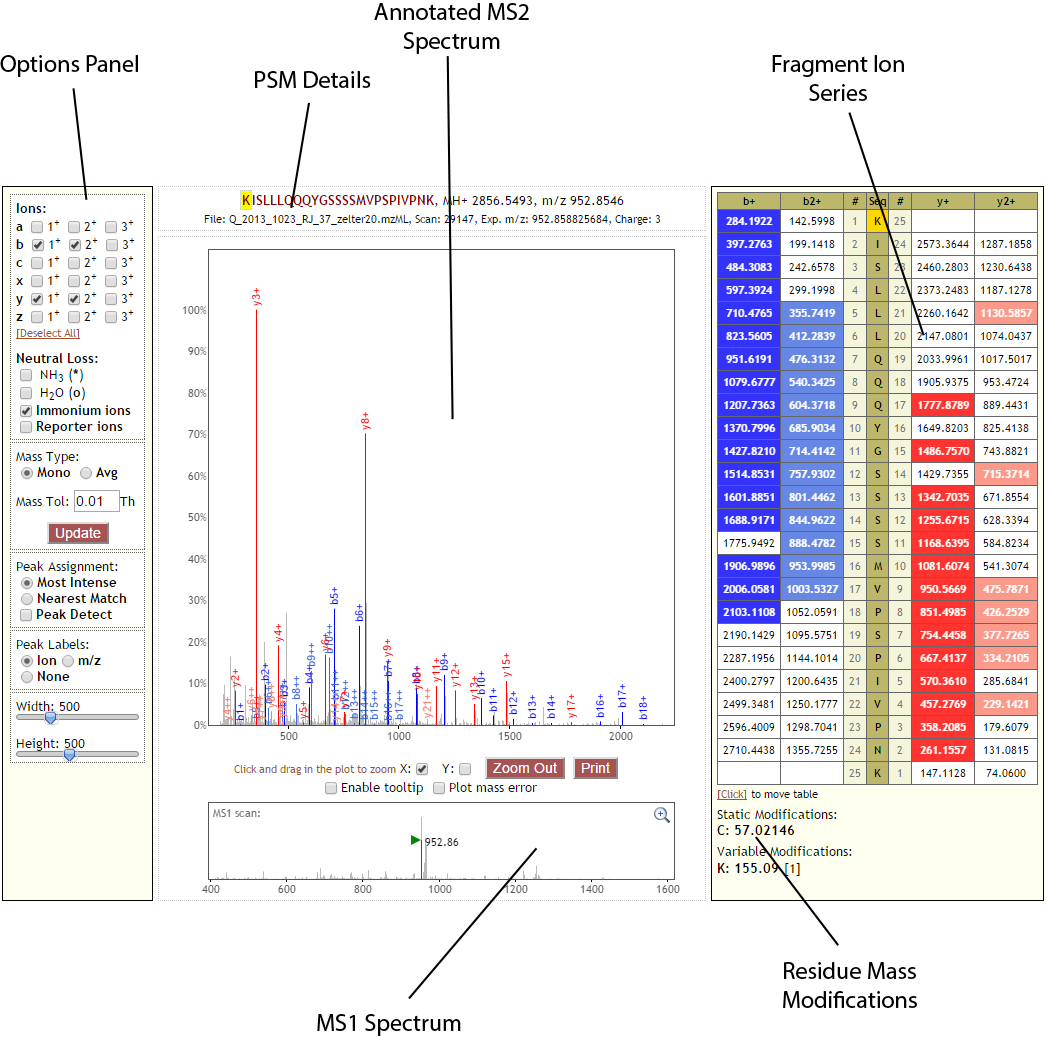
Options Panel
The options panel includes options for deciding which ions should be drawn, how peaks should be matched, dimensions of the viewer.
Ions
The Ions Panel allows the user to decide which types of ions should be matched and annotated on the spectrum. For example, checking the 1+ and 2+ checkboxes next to “b” be will annotate single and doubly charged b-ions. By default, all b- and y-ions up to the precursor charge minus one (up to +3) are checked. [Deselect All] will un-check all checkboxes.
Neutral Loss
The Neutral Loss panel allows for the optional annotation of ions resulting from the loss of neutrally charged molecules (water or ammonia) from fragment ions. Reporter ions and Immonium ions may also be labeled.
Mass Type
This panel determines how masses are calculated for the theoretical ions to match to the spectrum. “Mono” uses the monoisotopic mass of the fragment ion, “Avg” uses the average mass given natural isotopic abundances. (More Information.)
“Mass Tol” is the tolerance used to find peaks in the spectrum that correspond to the calculated masses of the theoretical fragment ions. A value of 0.01 will search the spectrum within plus or minus 0.01 Th of the calculated mass for matches to the theoretical fragment ion.
Peak Assignment
If more than one peak is found in the spectrum within the specified tolerance, this panel determines which of those peaks will be annotated as the fragment ion. “Most Intense” will label the most intense peak in the window and “Nearest Match” will label the peak with a m/z closest to the calculated m/z for the fragment ion.
Enabling “Peak Detect” will apply a filtering algorithm to the spectrum prior to attempting to match peaks. The displayed spectrum remains unchanged, this algorithm is applied for peak-matching purposes only. This algorithm is:
- Keep 50 most intense peaks
- If a peak is the most intense peak +/- 50m/z of itself, and there are fewer than 11 peaks in that window, keep it.
- If this peak’s intensity is >= 2 standard deviations above the mean in this window, keep it.
Peak Labels
These options determine how annotated peaks in the spectrum are labeled. Choosing “Ion” labels peaks according to fragment ion type, number, and charge (e.g., y8++ would be y-ion 8 with a +2 charge). Choosing “m/z” labels peaks according to the m/z of that peak in the spectrum. Choosing “None” removes the labels.
Width and Height
These sliders adjust the dimensions of the viewer.
PSM Details
The top row of this panel first gives the sequences of the matched peptide. Residues containing modifications are highlighted. Then the calculated MH+ (+1 charge) mass of the peptide is given. Then, the calculated m/z of the peptide is given, given the computed charge.
The bottom row gives the name of the spectral file in which this spectrum was found, the scan number in that file corresponding to this spectrum, the observed m/z of the parent ion in the MS1 scan, and the calculated charge.
Annotated MS2 Spectrum
This panel contains a rendering of the tandem mass spectrum, with m/z on the X axis and the intensity (relative to the most intense peak) on the y axis. Peaks that were matched to predicted ions are labeled and colored according to their type and charge, which matches the coloring in the Fragment Ion Series Panel.
Zooming
It is possible to zoom on the X and Y axis. By default, users may click and drag on the X axis to define a new range for the X axis. To define a new Y axis, check the “Y:” checkbox and click and drag to define a new Y axis maximum. Note: if both X and Y are checked, clicking and dragging will simultaneously define a new X range and a new Y maximum.
Print
Clicking the “Print” button opens the system print dialog containing a rendering of the PSM Details, Annotated MS2 Spectrum, and MS1 Spectrum panels.
Enable tooltip
If this option is selected, a tooltip will appear when mousing over peaks in the spectrum that shows m/z and intensity of that peak.
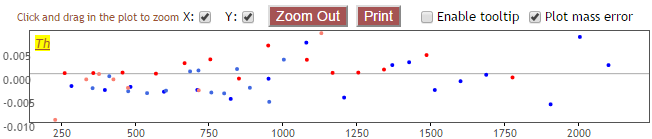
Plot mass error
If this option is selected, a plot will be presented below the checkbox that shows the difference of actual and theoretical mass of the matched ions:
MS1 Spectrum
This panel shows which peak from the MS1 scan was chosen for fragmentation resulting in the shown MS2 spectrum.
Zooming
It is possible to zoom on the X and Y axis. Click and drag to define a new range for the X-axis and a new maximum for the Y-axis.
Fragment Ion Series
This panel displays the calculated theoretical masses for the currently-selected ion types for the current peptide. The peptide sequence is displayed top-to-bottom for N-to-C terminus. Modified residues are highlighted. Ion types corresponding to the N-terminal side of fragmentation are displayed on the left side of the sequence, and the C-terminal side on the right-side of the sequence. Cells corresponding to matched peaks are colored, with those colors based on the type and charge of the ion, and match the colors in the annotated MS2 spectrum.
Residue Mass Modifications
Modifications present in the PSM are shown in this panel. “Static Modifications” are mass modifications applied to all instances of the given residue in the PSM search. “Variable Modifications” mass modifications that may or may not be present on the given residue during the search. The position of the variable modification in the peptide sequence is given in brackets.
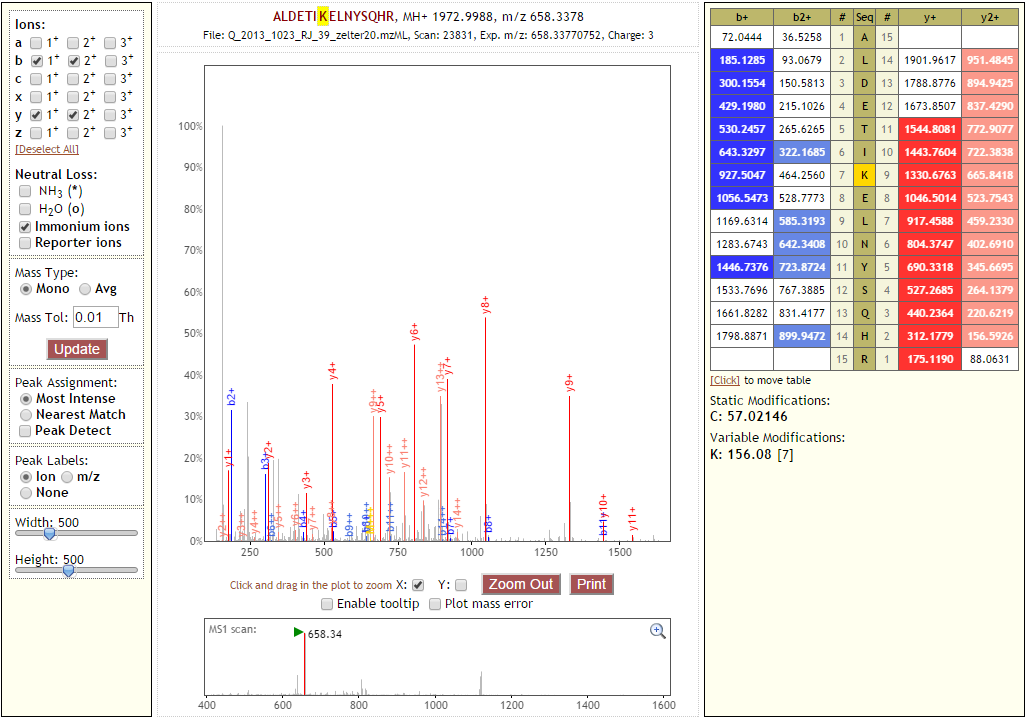
Monolink Spectrum
Monolinks in proxl are treated as modifications on residues in the same way as other post-translational modifications. There may be multiple monolinks present in the sequence, and monolinks may appear in unlinked, crosslinked or looplinked peptides. In the example below, the modification on the lysine at position 7 has a mass of 156.08, the mass of the crosslinker used in this experiment when it has bound to an amino acid on one end (but not the other). This residue is highlighted in the “PSM Details” area and in the sequence presented in the “Fragment Ion Series” panel. The modification is also listed in the “Residue Mass Modifications” below the “Fragment Ion Series” panel.
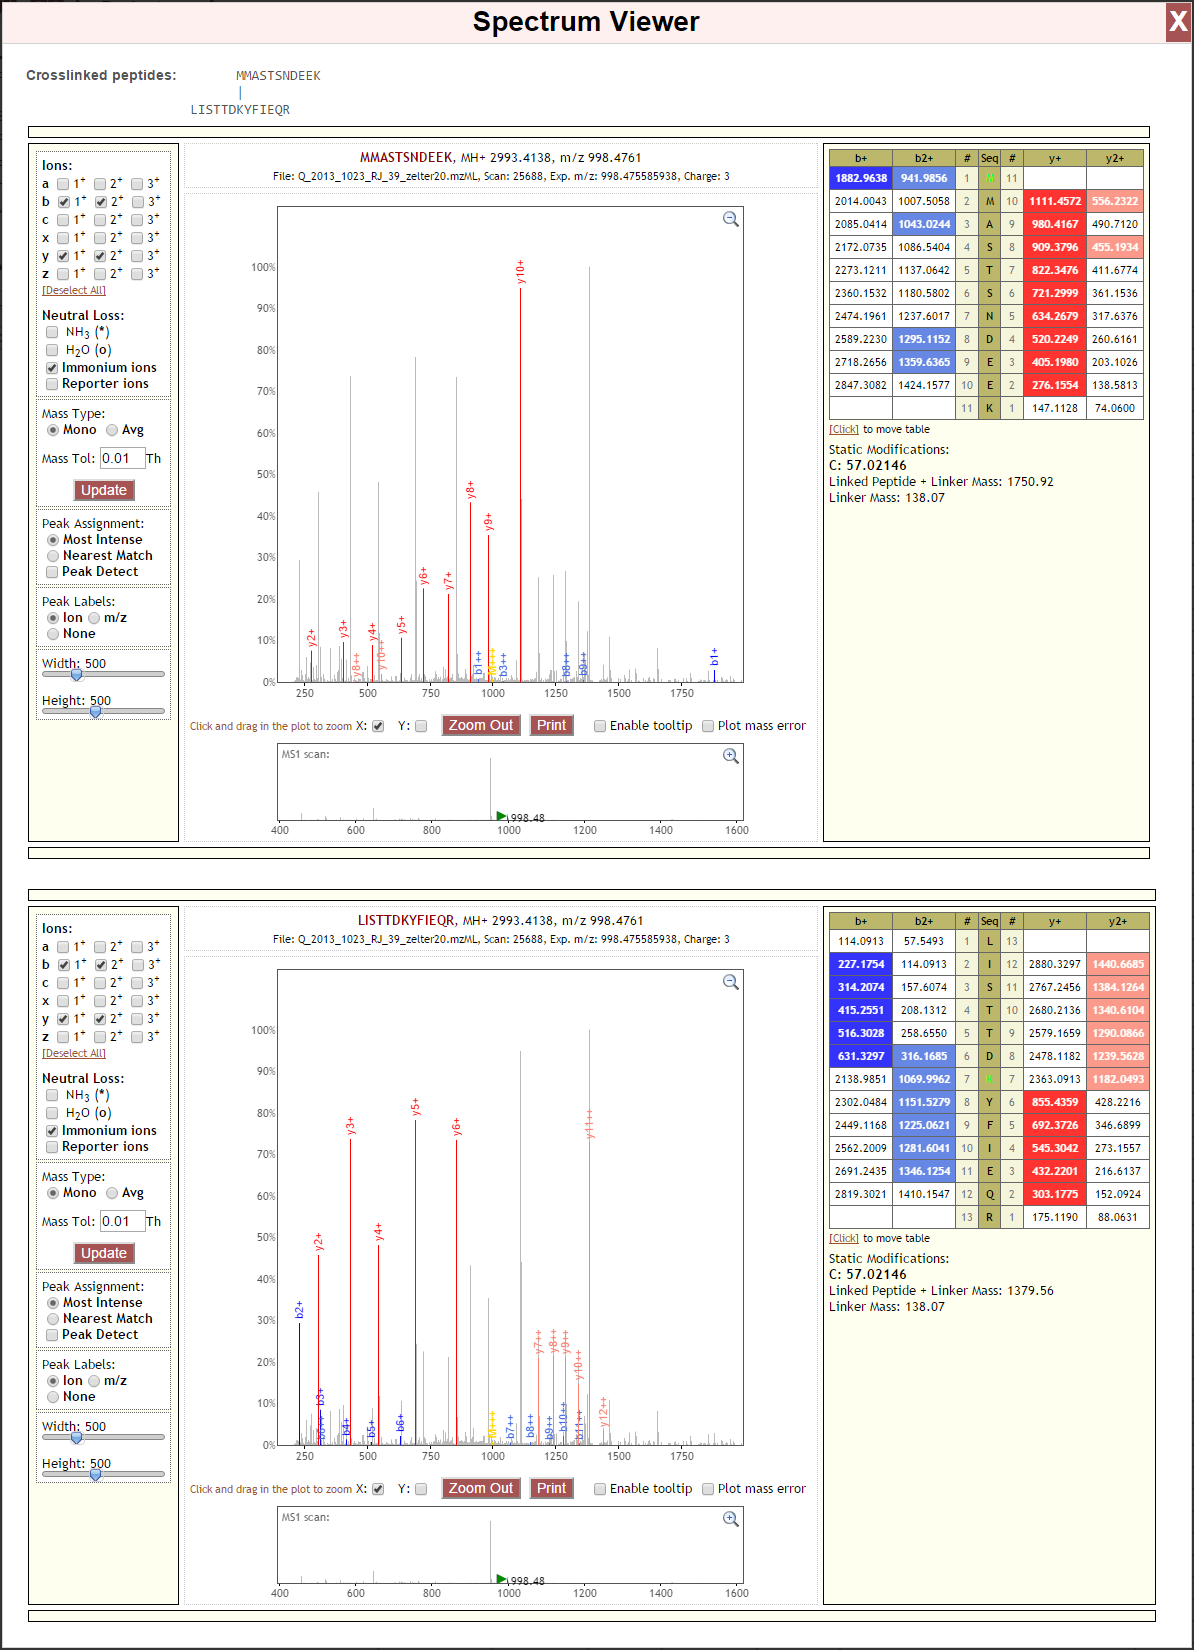
Crosslink Spectrum
Crosslinks between peptides may, from the point of view of each peptide, be thought of a large mass modification on the linked residue equal to the mass of the reacted crosslinker plus the mass of the other peptide. This is illustrated in the figure below. The hypothetical b- and y-ion series for the “circle” peptide and “square” peptide are given. Note that the opposite peptide is present as a modification on the linked residue in each peptide.
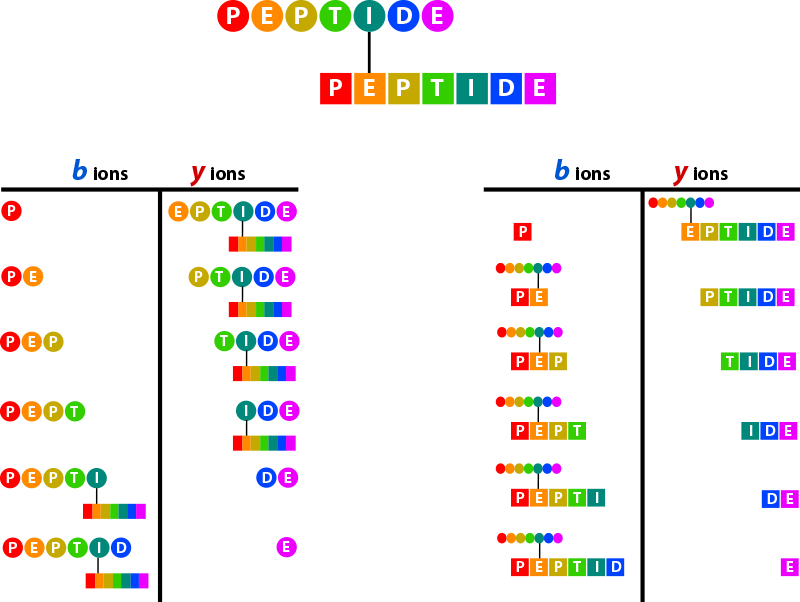
Proxl displays the ion series for each of the linked peptides separately. The sequences and positions of the crosslink are presented graphically at the top of the window. In the sequence presented in the “Fragment Ion Series” panel for each peptide, the linked residue is highlighted green.
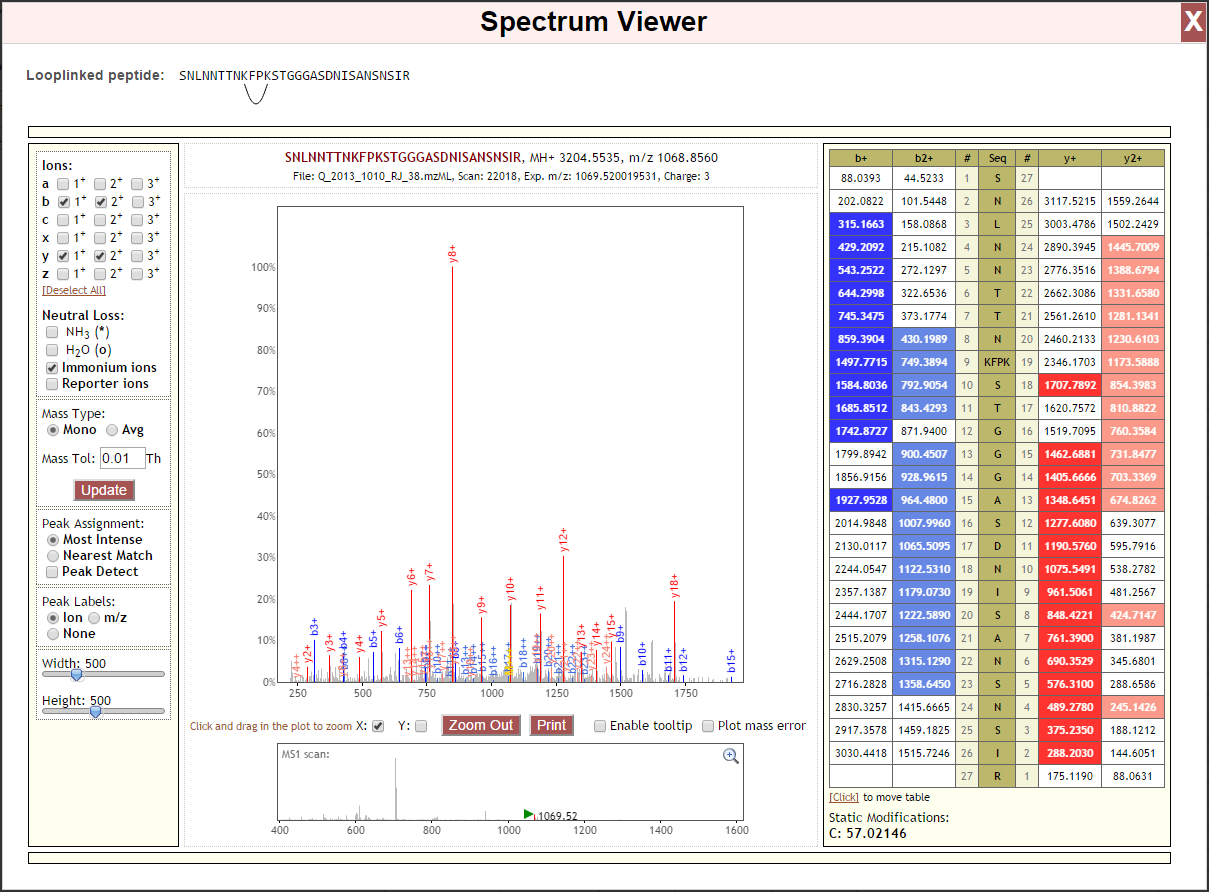
Looplink Spectrum
Looplink peptides contain a crosslinker that has linked two residues in the single peptide. When calculating ion series, proxl treats the sub-sequence between the linked residues (inclusive) as a single unit, as cleavages between the linked residues would result in crosslinked peptides–not a looplinked peptide. As a result, a hypothetical b- and y-ion series for a looplinked peptide would look be as follows:
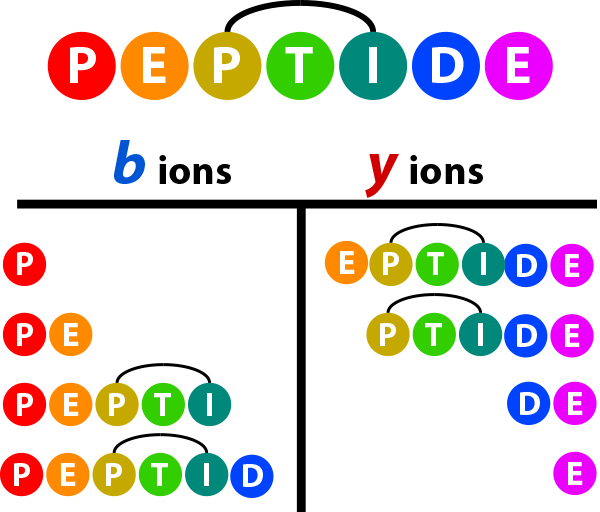
The subunit “PTI” is treated as a single residue normally would be when calculating the theoretical ion series. Below is an example spectrum displayed in Lorikeet that treats the looplinked subunit as a single entity. Note when moving to b9/y19, the mass is increased by the sum of KFPK plus the crosslinker.