Structure View Page
The structure viewer allows users to upload PDB files (including multi-protein complexes) from any source, align protein sequences from their experiment to sequences in those PDB files, and then visualize and interact with the crosslinking results on fully interactive 3D structures. The structure viewer includes multiple filtering and display options, distance reporting, and users may download the data for use in other structure visualization software or as high-quality raster images.
Viewer Basics
URL Captures State of Page
The URL of the page is dynamically updated at all times to reflect the complete state of the viewer–including filter parameters, protein bar positions, and all viewer options. As such, the URL may be bookmarked or shared to link to a viewer with the same content and appearance as the current viewer–just copy and paste from the address bar. For complicated visualizations, this is a convenient way to save and share you work. (Note, this link only works for other users who are listed on this project unless public access is enabled.)
Change Searches
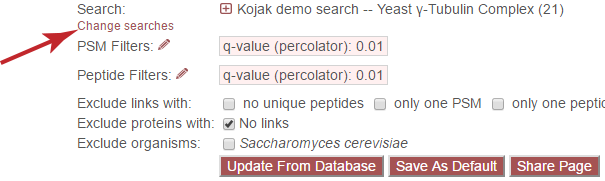
The “Change searches” link allows the user to change which searches are currently being displayed. None of the other options on the page (such as viewer settings) will be changed, only the searches from which data are displayed. Clicking the link causes the following overlay to be displayed:
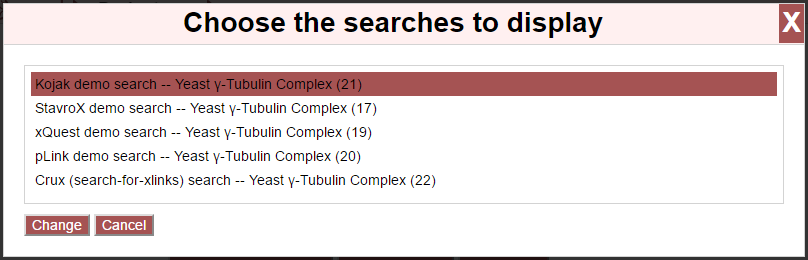
Select or de-select searches by clicking on them in the list. Once done, click “Change” to update the page with the new data or “Cancel” to close the overlay.
Update From Database
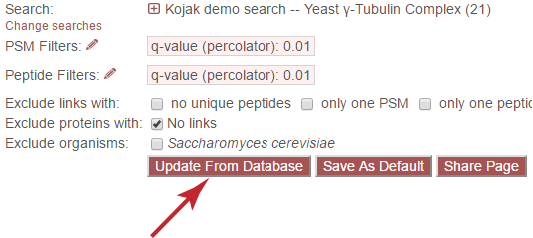
If the user changes any filter parameters–such as PSM/peptide score cutoffs, link type exclusions, protein exclusions, or taxonomic exclusions–this button must be clicked to reflect the new filter choices.
Save as Default
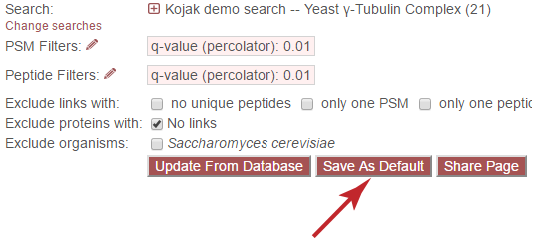
Project owners may click “Save as Default” to save the current URL (see above) as the default view of the “Structure View” for this search. This default view will be populated with the same proteins, positions, and viewer options as when the button is clicked. This is a convenient way to share data with collaborators or the public that does not require that they manipulate the image viewer to see the data.
Share Page
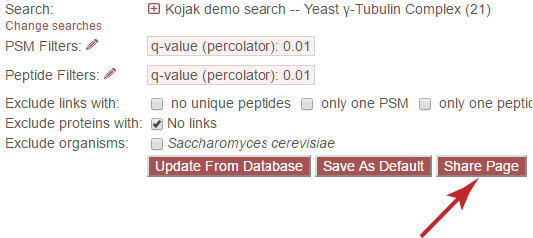
Clicking the “Share Page” button will generate a shortcut URL for viewing the current page, including all viewer settings, filter options, and so forth. The shortened URL will appear in an overlay as:
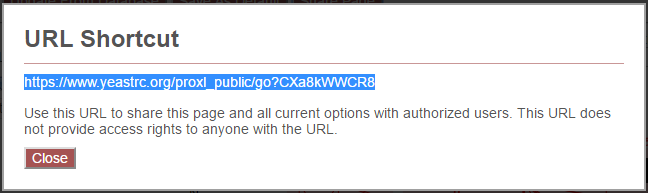
Copying and sharing the highlighted URL will direct users to the view of the page when the URL was generated. Note that this URL does not grant access to the page to any user that would not otherwise have access.
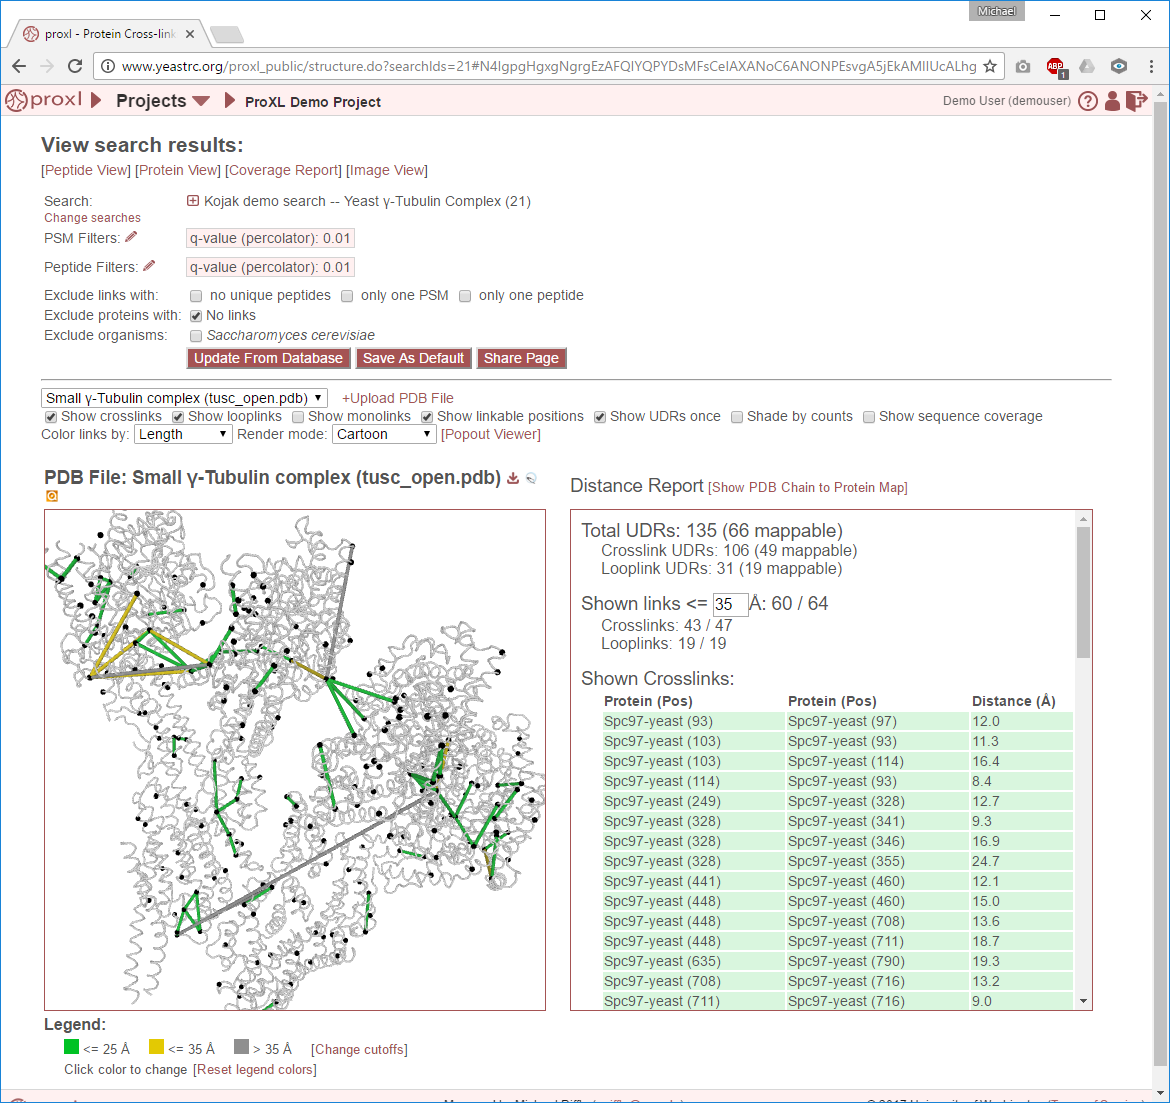
Viewer Display
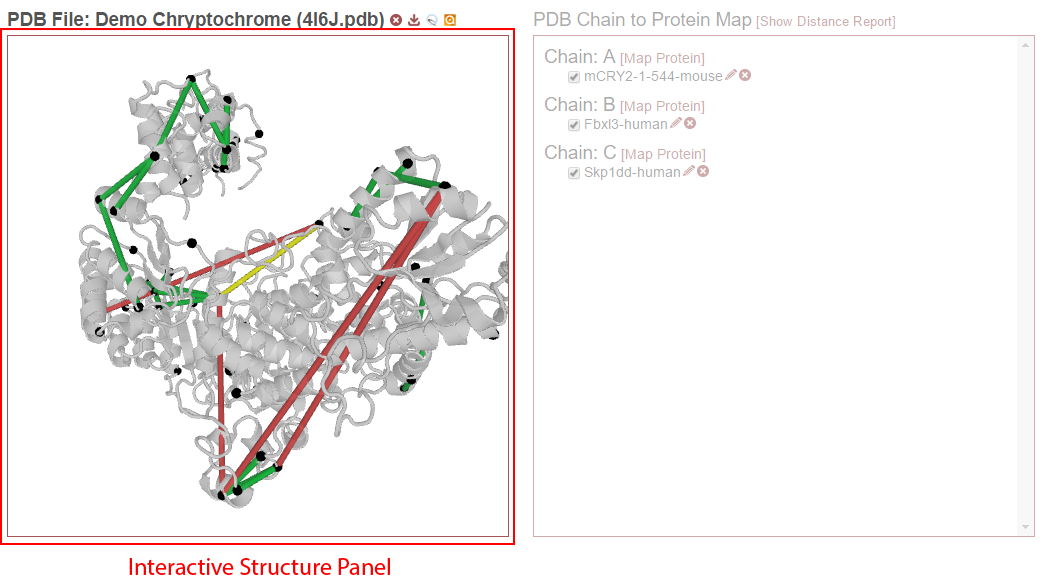
The viewer is separated into two side-by-side panels. The left panel contains an interactive, 3D rendering of the PDB structure file, link locations from the experiment, and other sequence annotations for those proteins. The right panel contains either a report of the distances of the currently-rendered links (see Distance Report) or a form for choosing which protein-PDB chain alignments are currently being drawn (see PDB Chain to Protein Map).
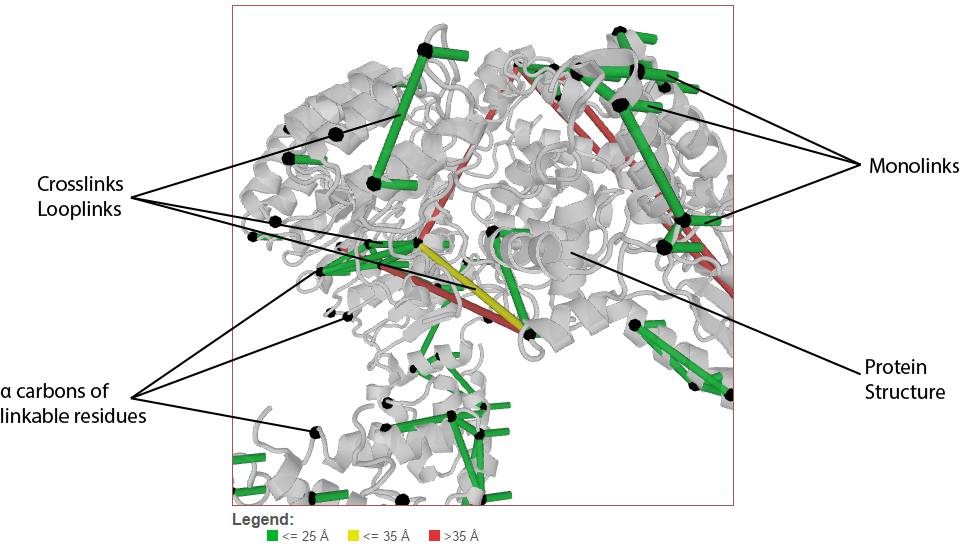
Crosslinks (and looplinks, if enabled) are displayed as rods connecting two points in the protein structure. By default, the color of these links is determined by the distance between the two points they connect. (This coloring scheme may be changed, see Color links by.) Monolinks are depicted as short rods connected to the structure on only one end. By default, “linkable” positions are shown as black spheres placed on the alpha carbons of residues in proteins that may react with the crosslinker used in the experiment.
Mapping Residue Position to 3D Space
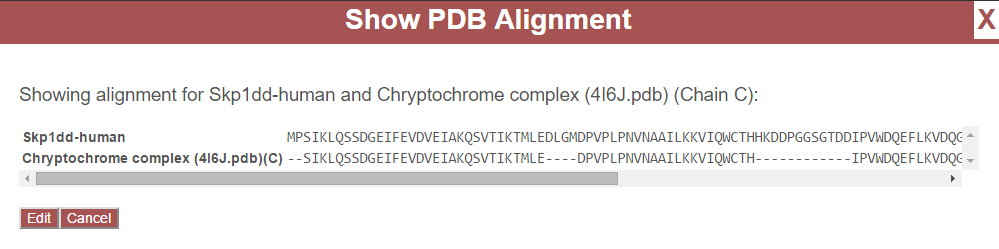
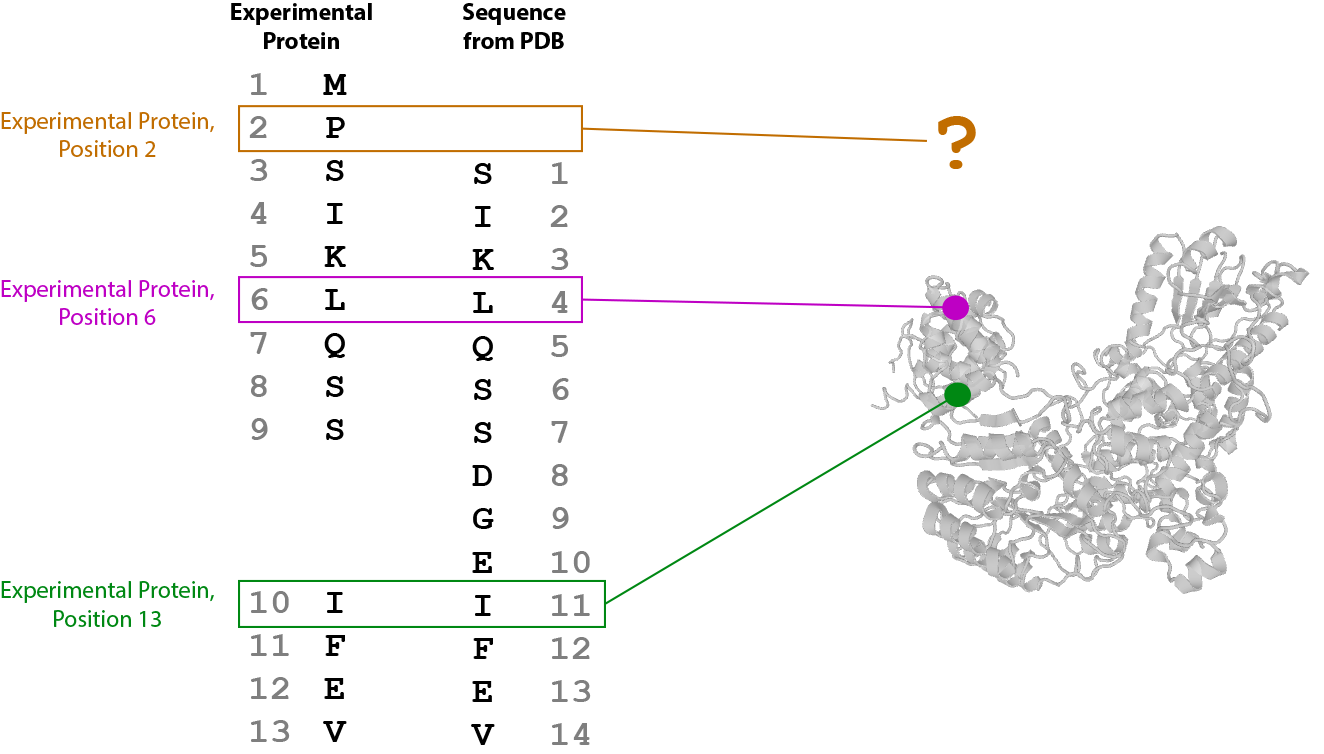
After a PDB file is uploaded, proteins found in the experiment may be mapped to chains from the PDB file based on sequence (see Map PDB Chains to Proteins). This process creates a mapping of residue positions in proteins found in the experiment to residue positions in the PDB structure. This mapping is very rarely 1 to 1, that is, the sequences of the protein and the PDB chain may be different–containing variation, insertions, or deletions. For example, view the following alignment between Skp1dd and chain C from 4I6J.pdb:
Note that position 1 in Skp1dd does not map to any position in chain C of the PDB file. Position 3 in Skp1dd maps to position 1 in chain C. Position 4 in Skip1dd maps to position 2, Position 5 maps to position 3, and so on. All insertions and deletions are taken into account to create a mapping for every position between the two sequences.
So, then, when drawing (or measuring distances between) positions that correspond to specific residues in experimental proteins, this mapping is used to lookup the corresponding positions in the PDB chain sequences. If the positions map to the PDB, the 3D coordinate position of the alpha carbon in the corresponding PDB residue is used as the location of the residue in the rendered structure. If the positions do not map to the PDB, they are never drawn or measured.
In proxl, links that map to the structure on both ends are said to be “mappable”. The distance report displays the number of mappable links from the experiment out of the total number of observed links. See Distance Report for more information.
Uploading PDB Files and Mapping Proteins
Upload PDB File
A PDB file in proxl is any file adhering to the PDB file format. These include public PDB files downloaded from the PDB database, or structures you have generated yourself using any number of programs– as long as they adhere to the PDB file format. The PDB file may contain structures for multiple proteins (such as for a protein complex). PDB files you upload to proxl are only visible to members of the project with which the data are associated. (If you enable public access on the project, the PDB file will be visible to public access users as well.)
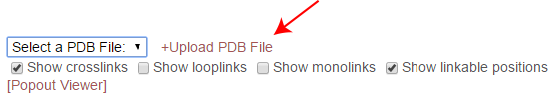
To upload a PDB file, click the “+Upload PDB File” link next to the PDB file pull-down menu above the viewer:
This will open a dialog for uploading a PDB file. Click the button next to “Select PDB File” to select a PDB file on your computer:
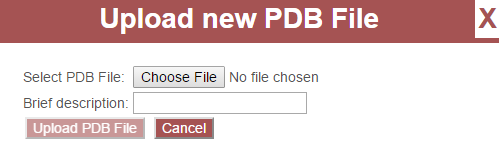
Enter a brief description for your PDB file and click “Upload PDB File.” The PDB file will then be visible in the PDB File pull-down menu.
Map PDB Chains to Proteins
In order to calculate distances or view crosslinking data on a 3D structure, it is necessary to first map proteins from the experiment to sequences present in a PDB file. (To learn more about how proxl uses this mapping to find 3D positions, see Mapping Residue Position to 3D Space.) The sequences in the PDB file do not need to be 100% matches to the protein sequences in your experiment, and may contain insertions or deletions. However, the quality of the reported distances and visualized links depends on the matches being close. It is also not necessary to map proteins to all chains in the PDB file.
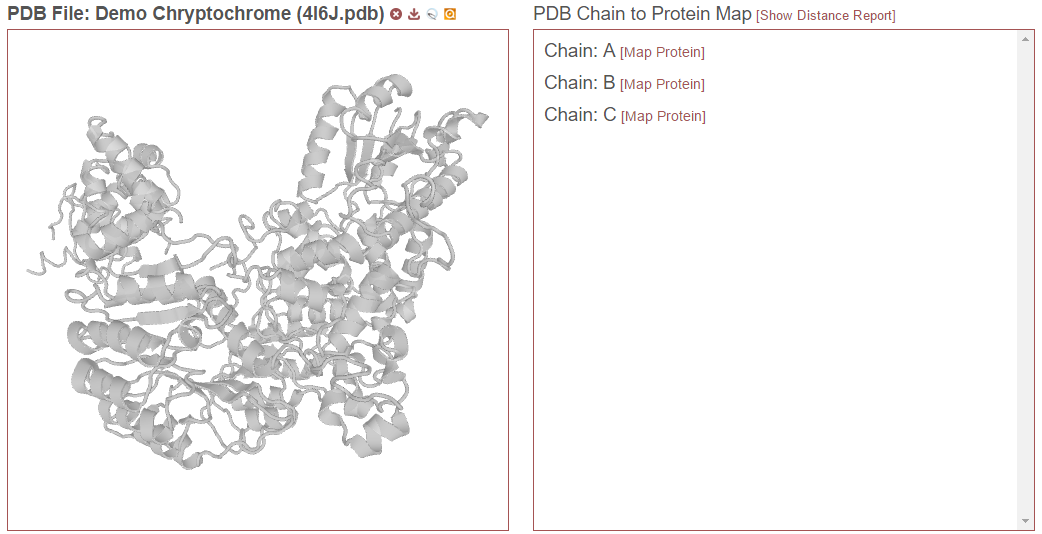
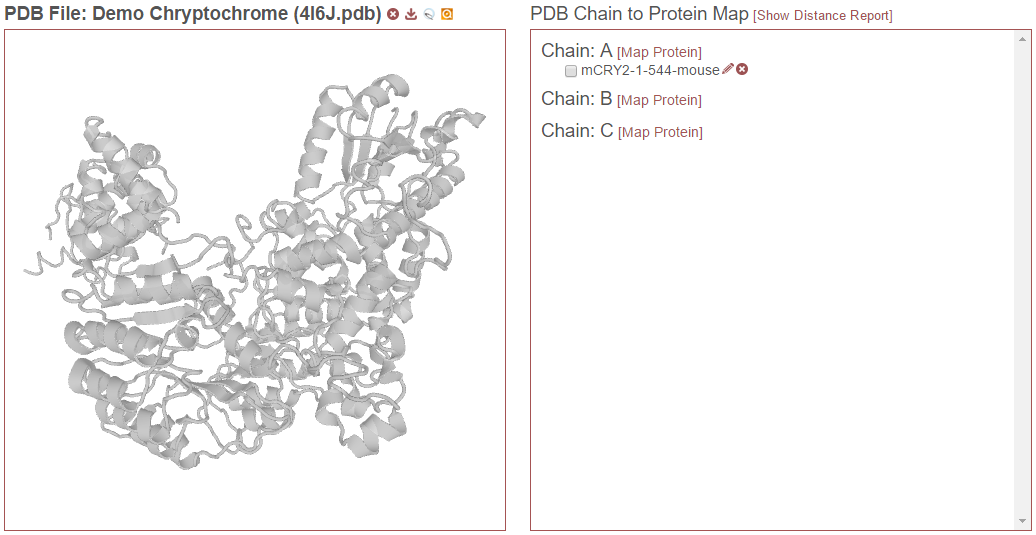
To perform this mapping, first select a PDB file in the PDB file pull-down menu. This will display the 3D structure from the PDB file in the left panel and, for proteins with no mapping, a “PDB Chain to Protein Map” in the right panel with no proteins listed for any of the chains.
To begin, click the “[Map Protein]” link next to the desired PDB chain. This will open the following window:
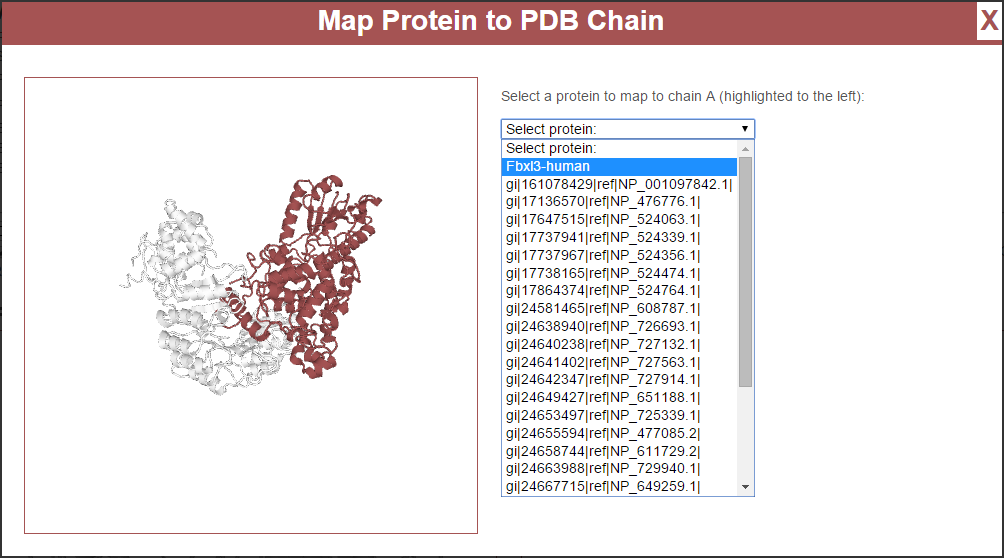
The panel to the left shows the structure from the PDB file, with the currently-selected chain highlighted in red. This rendering may be rotated and zoomed just as the main visualization, see Structure Manipulation. To the right is a pull-down list of all proteins found in the experiment. Click the one to be mapped to the currently-selected chain and click the “Map Protein to Structure” button. This will perform a local pairwise sequence alignment on the experimental protein’s sequence and the sequence for the selected chain from the PDB file and present the results in the window:
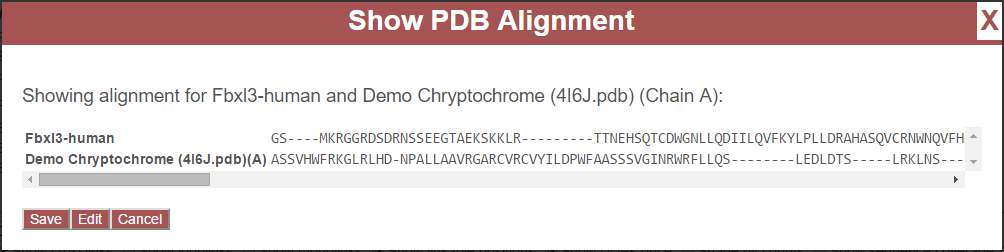
This is an example of a bad match. The pairwise sequence alignment will always be successful, even in the case of poor matches. In the example above, “Fbxl3-human” was chosen and a sequence alignment was performed against chain A from 4I6J.pdb. Note that very few residues match between the alignments, and there are many insertions and deletions present. The horizontal scroll bar present beneath the alignment may be used to view the entire alignment. To reject this alignment, click “Cancel” to map a different protein.
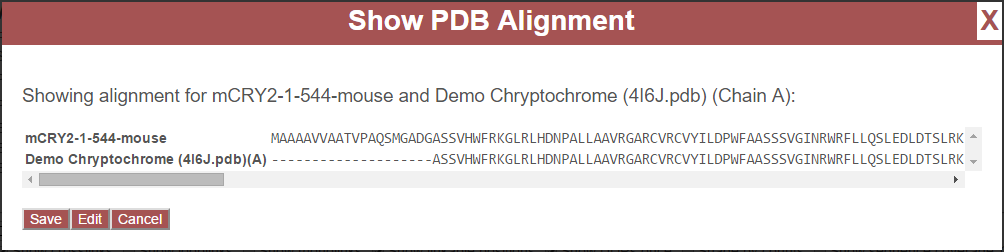
This is an example of a good match. In the example above, “mCRY2-1-544-mouse” was chosen as the experimental protein. All the matched residues are identical. There is a segment of sequence at the N-terminus of the experimental protein that is not present in the PDB file. To accept this match, click “Save.” The mapped protein will now appear as associated with Chain A in the “PDB Chain to Protein Map”:
This process can be repeated for as many other chains as desired. Additionally, each chain may be associated with multiple proteins from the experiment–such as in the case that homologs or proteoforms are present in the search results. However, only up to one protein listed under a given chain may be checked at any given time.
Then, to view the crosslinking results on the structure, check the desired protein chain alignments (check box next to a given protein listed under a given chain). To learn more about the effects and implications of checking the alignments, see PDB Chain to Protein Map.
Edit PDB Chain to Protein Mapping
Although not generally advised, there are two methods for manually editing the alignment between an experimental protein and a PDB chain. First, during the initial mapping process described above, instead of clicking “Save” or “Cancel” on the final step, click “Edit.” Or, after the mapping is complete, click the pencil icon next to the protein name associated with a chain in the PDB and click “Edit” in the resulting window. Both methods will open the alignment edit window:
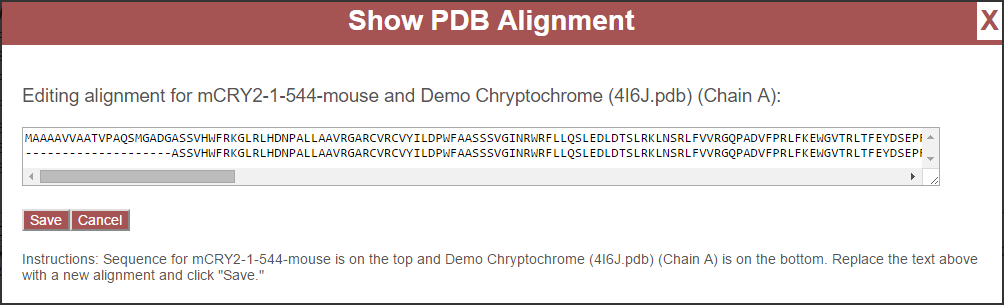
This interface consists of a simple text field containing the current pairwise sequence alignment, with the experimental protein on the top and the PDB sequence on the bottom. This alignment may be manually edited, either in this window or in an external text editor and pasted back into this window. The length of both aligned sequences, including the dashes (-) must be identical, and the sequences present for the experimental protein and PDB chain (without the dashes) must match the sequences on record. To cancel the process, click “Cancel”. To save the manual alignment, click “Save.”
Delete PDB Chain to Protein Mapping
Click the red circle (X) icon next to the protein listed for a chain in the PDB on the “PDB Chain to Protein Map” panel to remove that alignment from the database.
Interactive Structure Panel
This section describes the functionality and features of the left panel, where the 3D protein structures are presented:
Structure Manipulation
Rotation
Using a mouse, the structure may be rotated on a central axis by clicking and dragging in the panel–that is, click, hold down mouse button, and move the mouse cursor in the desired direction of rotation. On touch devices, simply tap, hold, and slide finger in desired direction of rotation.
Zooming
To zoom in or out using a mouse, use the scroll wheel–slide the scroll wheel towards you to zoom in and away from you to zoom out. On touch devices, pinch and zoom with two fingers to zoom in or to zoom out.
Re-centering
Double clicking on the structure will move the center of rotation to that point and re-center the view of the structure to that point.
Click on Links
Any link (crosslink, looplinks or monolink) may be clicked on to view underlying link information (such as which positions in which proteins are connected), a peptide list for peptides found to support those links, a list of corresponding PSMs, and view associated spectra.
Clicking a link will open a window that lists the link information and underlying peptide list:
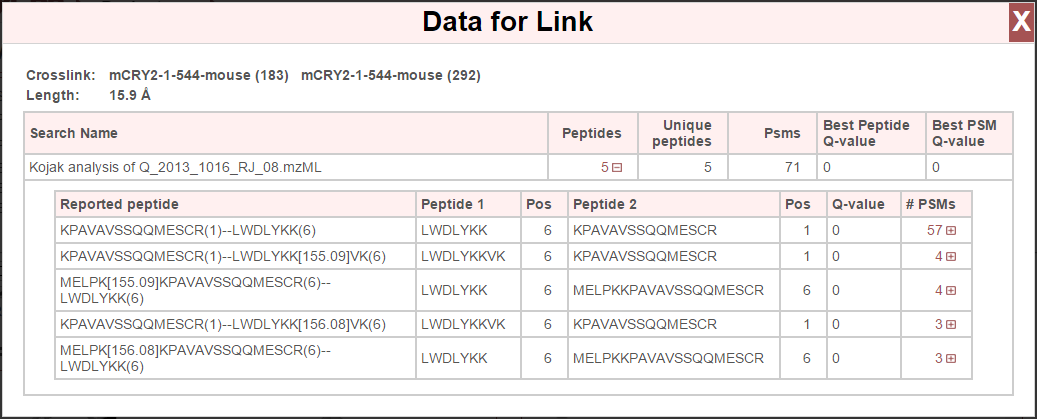
At the top are the linked proteins, their respective positions, and the distance of that link. A list of peptides is then presented for each search (if viewing data from multiple searches, each search is listed) that support this link. Any of the rows listing peptides may be clicked and expanded to view the underlying PSMs:
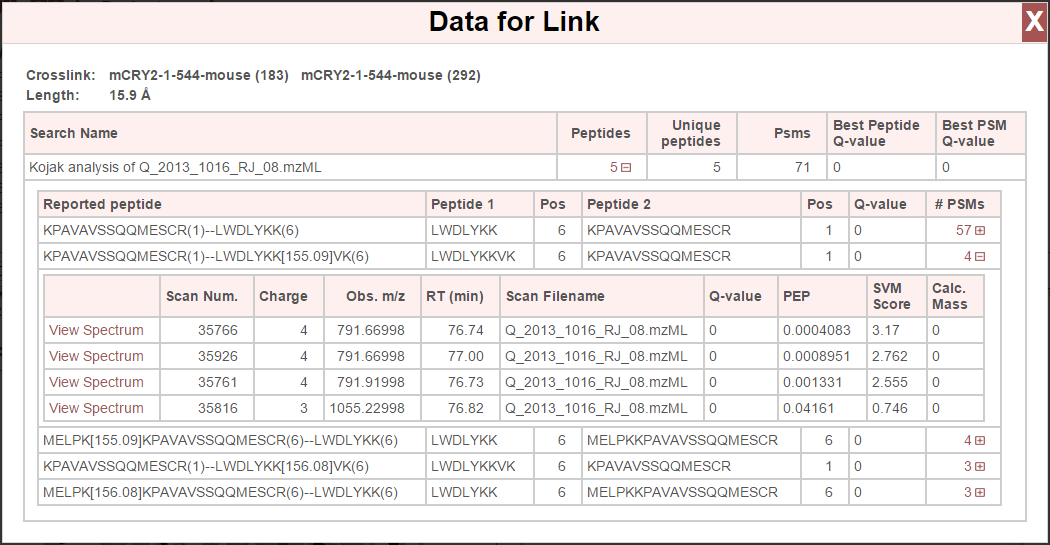
The “View Spectrum” link for each PSM will show the respective spectrum using the built-in spectrum viewer. See Spectrum Viewer for more information.
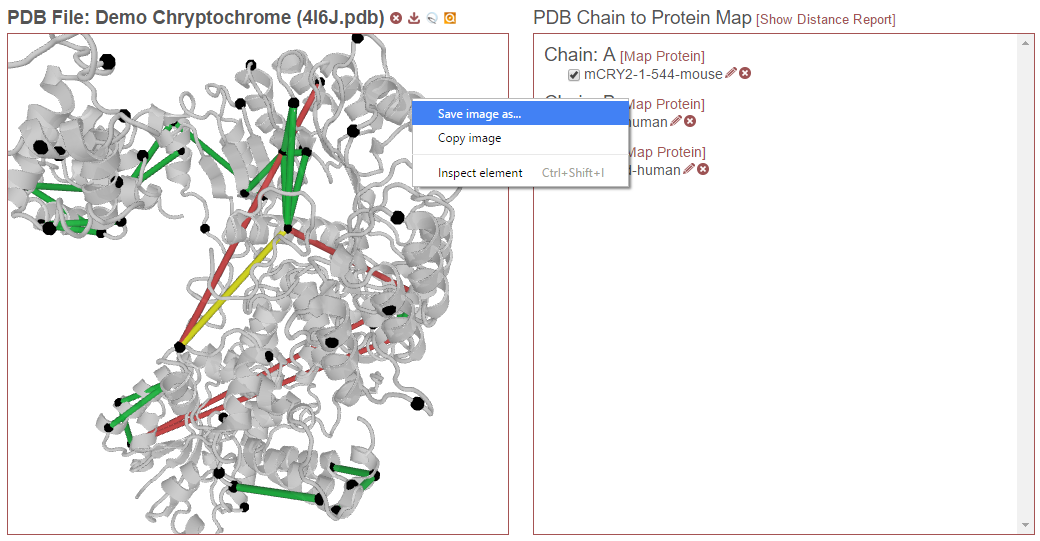
Save Image of Structure
Right-click the structure to save the current view as an image. This image has the same dimensions as the view window. To capture a high resolution image of the structure, use the Popout Viewer function to view the structure in a separate window, make that window as large as possible and then save the view as an image.
Popout Viewer
The structure viewer may be “popped out” into a separate window by clicking the “[Popout Viewer]” link next to the viewer options:
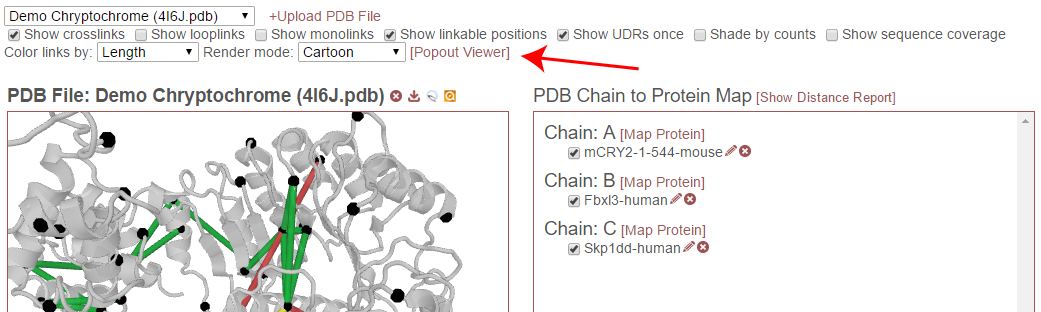
Clicking this link creates a new browser window with a structure viewer that fills that window:
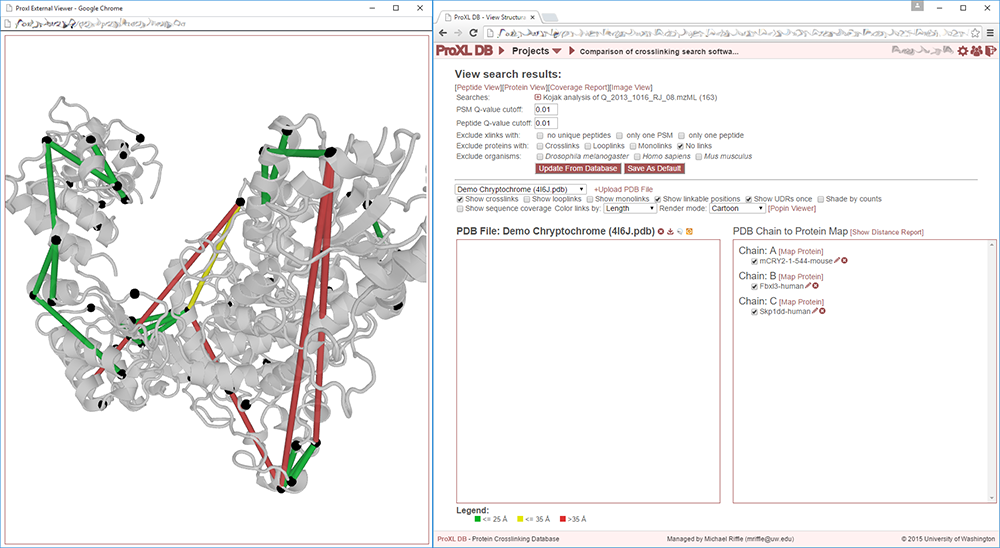
Resizing the new window dynamically changes the size of the structure viewer so that it always fills the window. The separate window allows for enhanced exploration of the structure. Not only is the structure larger and easier to see, but clicking on links in the viewer will open windows for those links in the original window without obscuring the structure. This is further enhanced in a multi-monitor environment, where it is possible to run the structure viewer full-screen on its own monitor.
The separate window also allows for the download of much higher resolution images of the structure, since the downloaded image has the same resolution as the 3D rendering of the structure. To download the image, right-click on the structure in the new window and choose to save the image to your computer or device.
Popin Viewer
To pop the structure viewer back into the original panel, simply close the new window or click the “[Popin Viewer]” link where the “[Popout Viewer]” link was originally.
Delete PDB File
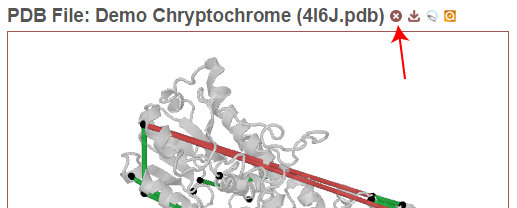
Project owners may delete a PDB file from by clicking the red (X) icon above the structure view panel. This will remove the PDB file from this project and make it unavailable to users of the project. Note, if the same PDB file has been uploaded to other projects, those will be unaffected.
Download PDB File
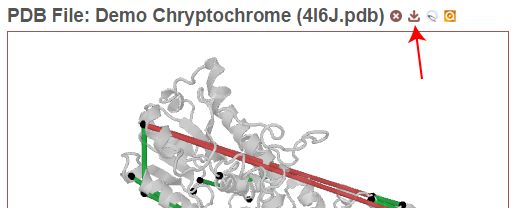
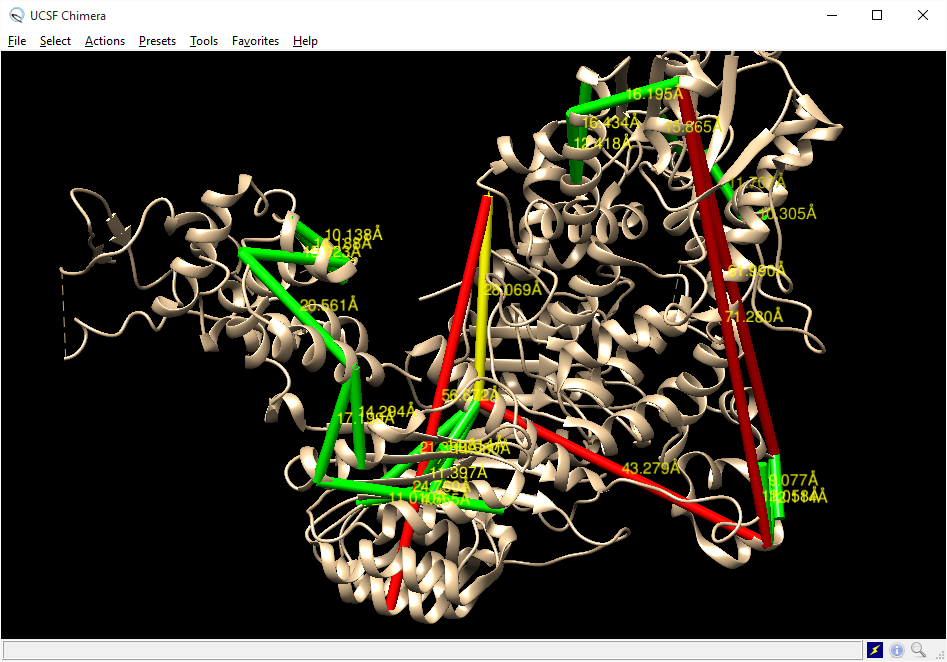
Project members (or public access users, if enabled) may download the PDB file by clicking the download icon above the structure view panel. This file is suitable for viewing in structure viewing software such as Chimera or Pymol.
Download Chimera Script

Project members (or public access users, if enabled) may download a Chimera script that will draw the currently-visible links onto the current PDB file by clicking the Chimera icon above the stucture view panel. This script may be run in Chimera after loading the PDB file, by choosing “File->Open”, choosing the script that was downloaded, and choosing “Chimera Commands” as the file type.
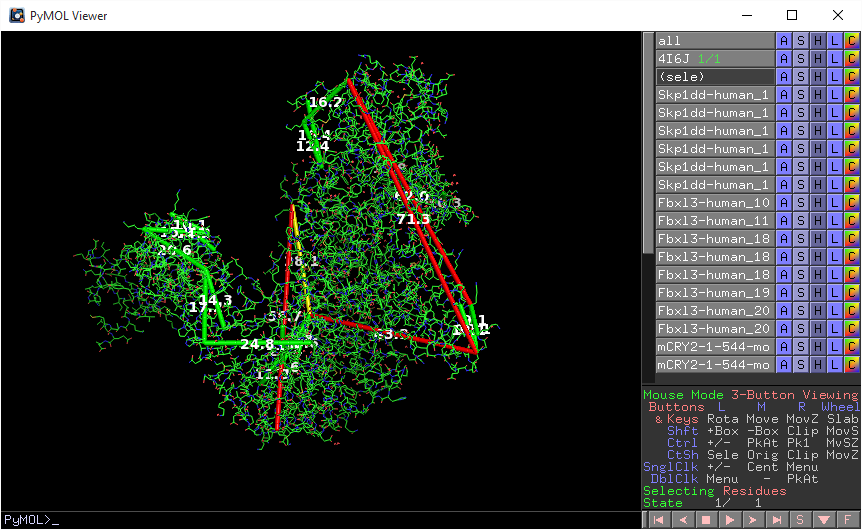
Download Pymol Script
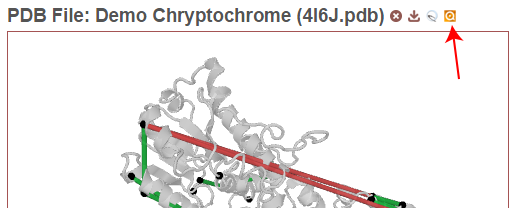
Project members (or public access users, if enabled) may download a Pymol script that will draw the currently-visible links onto the current PDB file by clicking the Pymol icon above the stucture view panel. This script may be run in Pymol after loading the PDB file by typing “@C:locationtoscript.txt” in the Pymol command line (where C:locationtoscript.txt is the actual location of the downloaded file).
PDB Chain to Protein Map
This section describes the functionality and features of the default right panel, where the proteins from the experiment that have been aligned to chains in the PDB file are displayed. (If the Distance Report is currently visible in place of this panel, click the “[Show PDB Chain to Protein Map]” link above the report.)
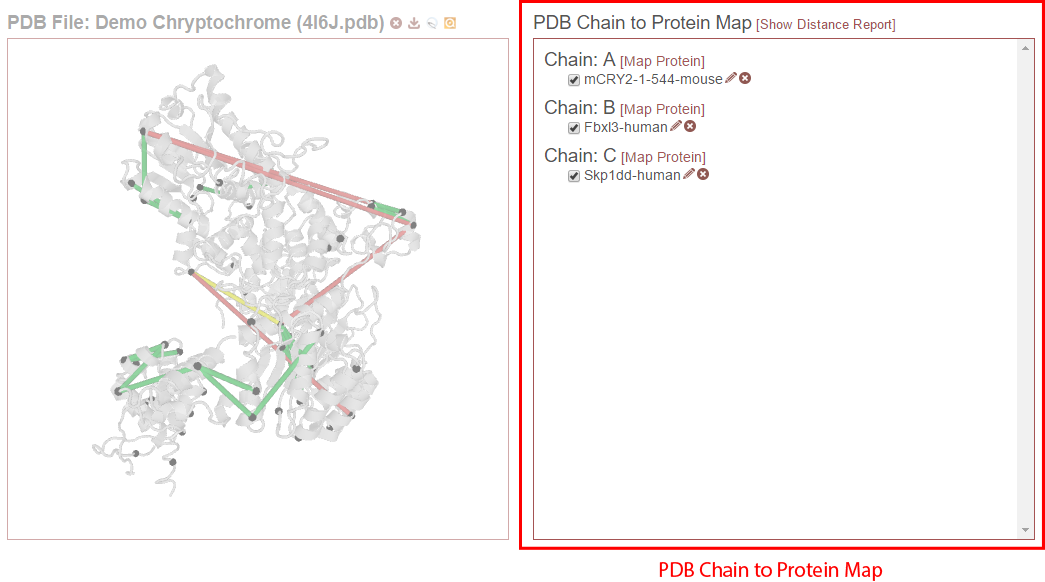
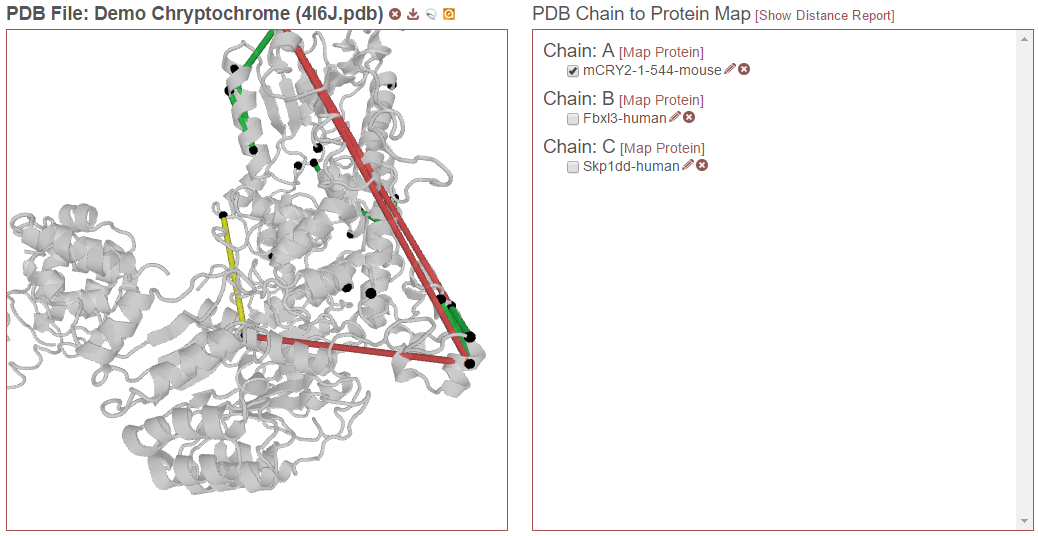
The PDB Chain to Protein Map shows which proteins from the experiment have been mapped to which chains present in the currently-selected PDB file. The check box next to each protein indicates if that specific alignment is currently being considered when drawing links on the structure or generating the distance report. Alignments (that is a specific protein mapped to a PDB chain) that are not checked are not being considered. For example, in the figure below, only “mCRY2-1-544-mouse” is selected in Chain A. The only links drawn on the structure will only involve that protein and will only be drawn on Chain A. (If that protein were to other chains, and they were not checked, only chain A would be considered for drawing links or reporting distances.)
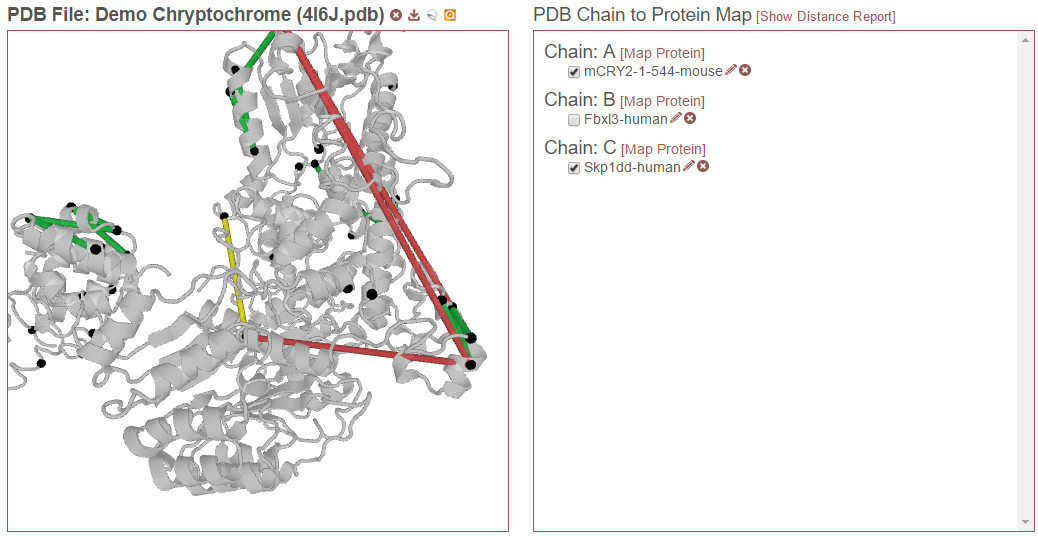
Then, in the example below, “Skp1dd-human” on chain C is also checked. Now this protein aligned to this chain will also be considered for drawing links and reporting distances:
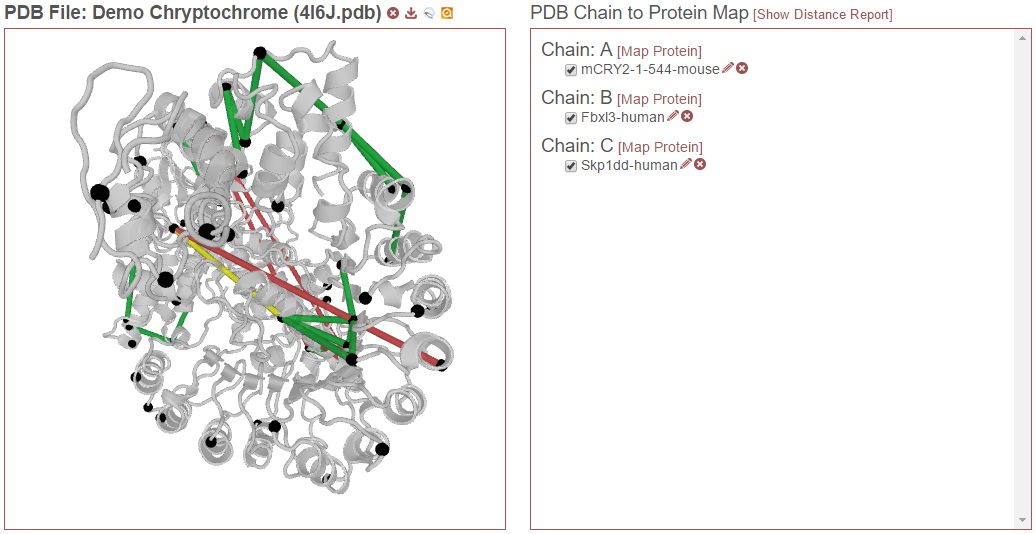
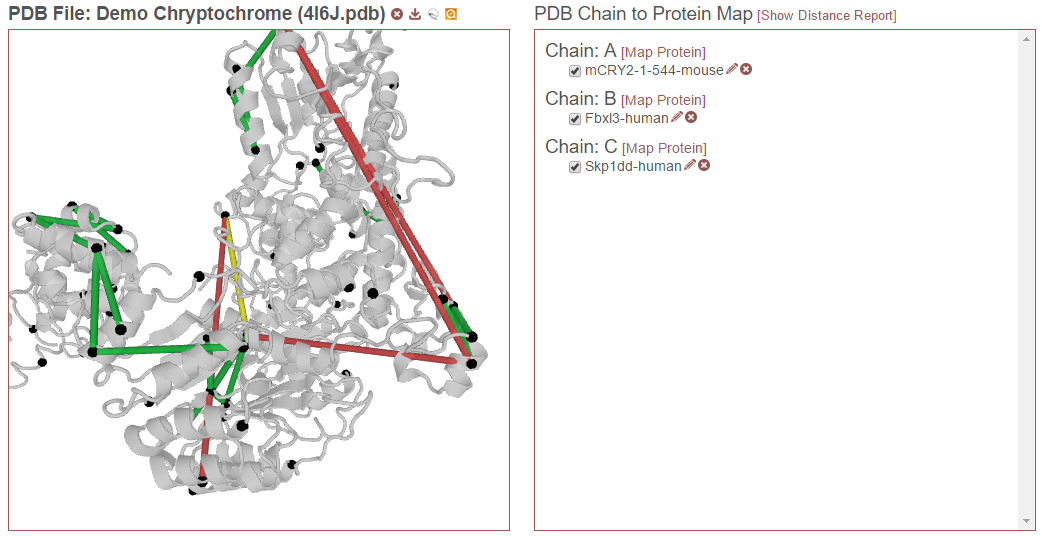
Finally, in the example below, “Fbxl3-human” on chain B is also selected. Now this alignment will also be considered:
Note that it is possible for a given chain in a PDB to be aligned to multiple proteins in the experiment, such as when homologs or proteoforms were present in the proteomics search database. In this case, only one alignment for a given chain may be checked at a time.
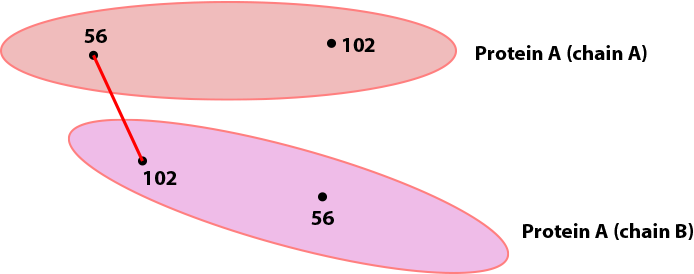
Further note that it is also possible for the same protein to be mapped to multiple chains in the PDB, such as if the PDB depicts an oligomer. In this case, it is certainly possible to check that same protein multiple times for the different chains; however, this creates multiple possibilities for where links may be drawn on the PDB. As an example, the figure below depicts a cartoon of the same protein mapped two chains, A and B. A crosslink between positions 56 and 102 was observed. If the alignment for Protein A is checked for both chains A and B, there are four possibilities for where to draw the crosslink (each corresponding to a different distance):
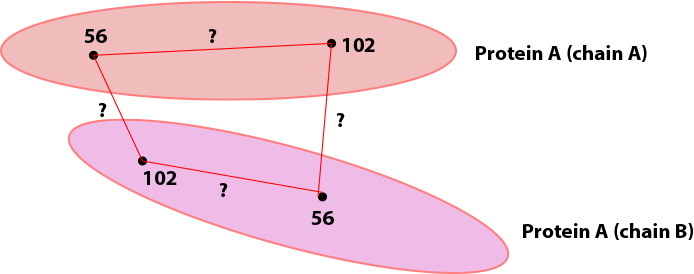
By default, proxl will pick the shortest possibility and only draw that one:
This behavior may be changed, see Show UDRs once for more information.
Add New Alignment
For a description of how to map proteins to chains in the PDB file, see Map PDB Chains to Proteins.
View Alignment
As shown below, project owners and non-owners have a different set of options associated with protein/PDB alignments:
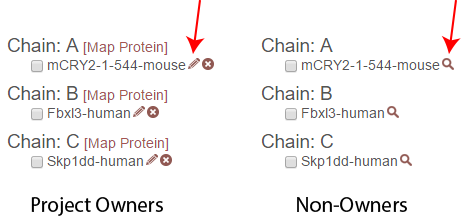
Owners may click on the edit icon (pencil icon) to either view or manually edit the alignment. Non owners may click on the examine icon (magnifying glass icon) to view the alignment.
Edit Alignment
Project owners may click on the edit icon (pencil icon) next to the protein/PDB alignment they wish to view or edit.
Delete Alignment
Project owners may click the delete icon ((X) icon) next to the protein/PDB alignment they wish to delete. Deleting the alignment removes it from the database and makes it unavailable for all users.
Distance Report
This section describes the functionality and features of the right panel when the distance report is being displayed. To display the distance report, click the “[Show Distance Report]” link above the PDB Chain to Protein Map.
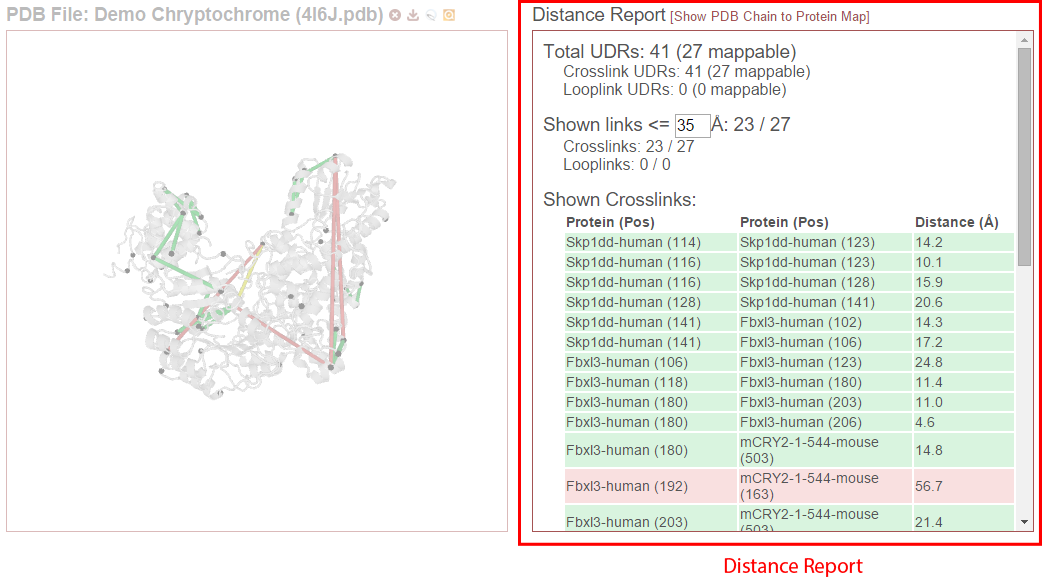
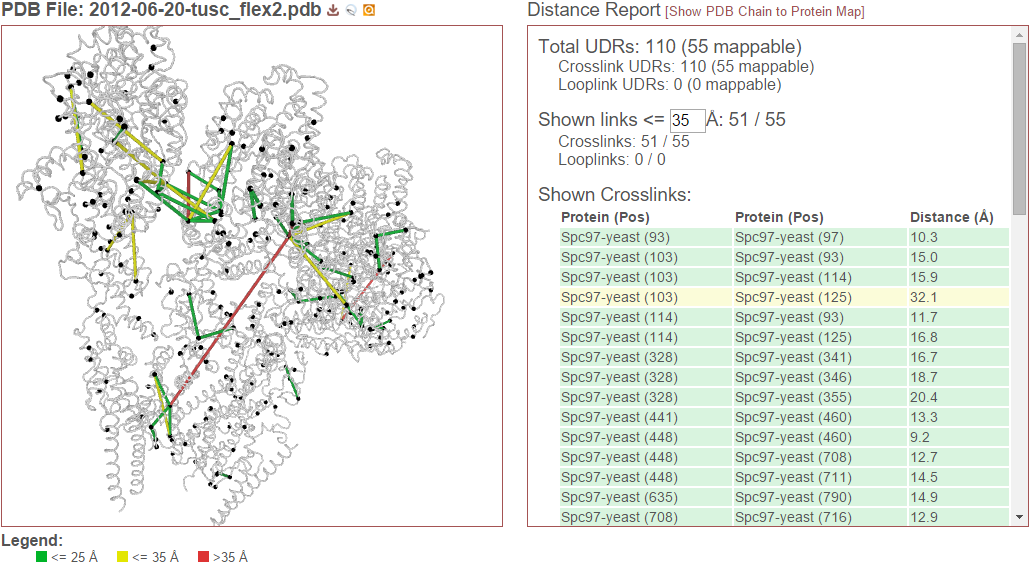
The distance report shows three primary types of data: 1) Total UDRs, or the number of observed links of each type that were mappable to the structure, 2) Shown Links, or the number and proportion of the currently-visible links that have distances less than or equal to a user-supplied distance cutoff, and 3) Shown Crosslinks/Shown Looplinks, which is a table of shown links and their distances
Links are drawn (and distances measured) between alpha carbons from PDB residues mapped to the respective residues from the experimental protein. To learn more about this mapping, see Mapping Residue Position to 3D Space.
Total UDRs
UDR stands for “unique distance restraint.” In proxl, this is the name for a distinct position in a protein linked to a distinct position in the same or another protein. This section of the distance report reports the total number of such UDRs present in the data, and how many of those are mappable to the structure. To learn more about what “mappable” means or about how proxl maps protein positions to PDB structure, see Mapping Residue Position to 3D Space.
Shown links
This section shows the number of UDRs (that were mappable to the structure) have distances less than or equal to the supplied distance cutoff. (This defaults to 35 Angstroms.) This cutoff may be changed simply by changing its value in the text field–the report will dynamic update as the value is changed.
Shown Crosslinks / Shown Looplinks
These tables list the crosslinks and/or looplinks currently being shown on the structure. The coloring of the rows matches the coloring of those links on the structure–even if an alternate coloring scheme is chosen (see Color links by). Each of the rows shows the positions in respective proteins that are linked, as well as the distance of that link in Angstroms. All of the currently drawn crosslinks and/or looplinks will be listed in the table.
Each row may be clicked on (or tapped on touch devices) to view the underlying peptides, PSMs, and spectra. See Click on Links for more information.
Download Reports
At the bottom of the “Distance Report” panel is “Download reports”. Click on the name of the report to initiate a download.
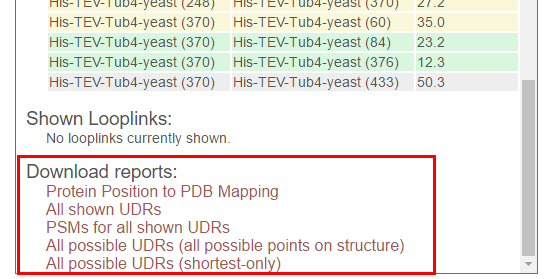
Available reports are:
- Protein Position to PDB Mapping - A tab-delimited file showing the pair-wise mapping of the protein sequences in the experiment to the PDB file.
- All shown UDRs - A tab-delimited report of all currently-displayed UDRs, showing protein positions, distances, and PSM/peptide scoring statistics.
- PSMs for all shown UDRs - A tab-delimited report of all PSMs for all currently-displayed UDRs, including scoring statistics for those PSMs.
- All possible UDRs (all possible points on structure) - A tab-delimited report of all theoretically possible cross-links on the structure, given the cross-linker that was used.
- All possible UDRs (shortest-only) - A tab-delimited report of all possible cross-links on the structure, given the cross-linker that was used. Only the shortest cross-link for each unique protein pair and position is reported. This is useful when proteins appear more than once in the structure.
Viewer Options
Show crosslinks
Toggle the showing of crosslinks on and off.
Show looplinks
Toggle the showing of looplinks on and off.
Show monolinks
Toggle the showing of monolinks on and off.
Show linkable positions
Toggle the showing of linkable positions. Linkable positions appear as black spheres on the alpha carbons of residues in the PDB that mapped to linkable positions in the experimental protein. A linkable position is a residue expected to be theoretically linkable by the crosslinker used in the experiment.
Show UDRs once
Maybe I should delete this feature.
Shade by counts
If enabled, the opacity (transparency) of links reflects the number of PSMs found (or spectrum count) for the shown link. The shading scales from 1 PSM (minimum opacity, most transparent) to 10 PSMs (maximum opacity). Any link having 10 or more PSMs will have the maximum opacity.
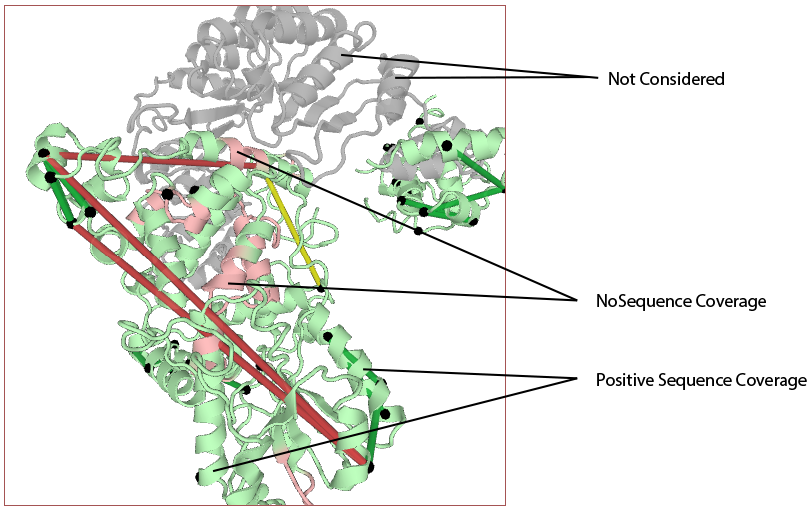
Show sequence coverage
If enabled, the color of the structure, itself, will reflect the sequence coverage for the protein mapped to the respective chain. Segments of the structure will be shaded green where those residues map to experimental protein residues that were contained in any observed peptide (at the given cutoffs). Segments will be shaded red where no peptides were observed that contained those residues. Areas of the structure not being considered (either residues that do not map to experimental protein residues orno protein/PDB aligments are enabled for that chain) will appear as white.
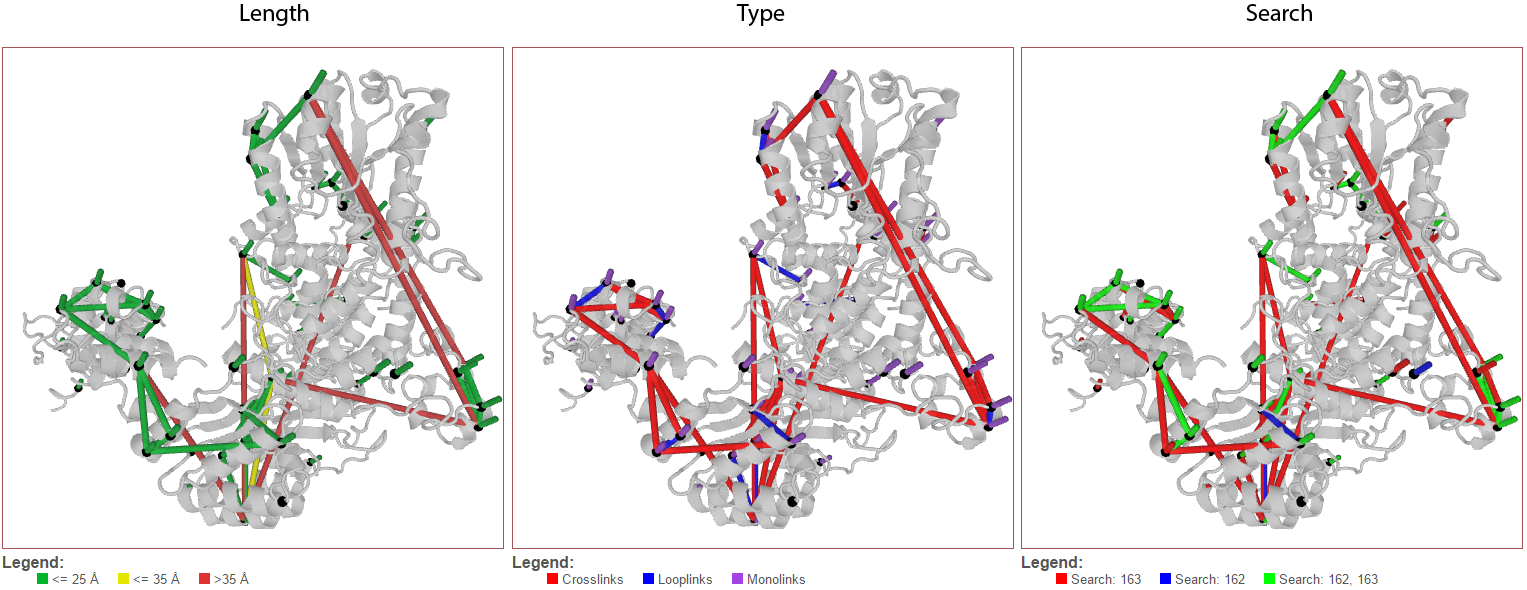
Color links by
This pull-down menu alters the coloring applied to the links. The three options are 1) Length (default), 2) Type, and 3) Search.
Length (default)
This option colors links based on their length.
Type
This option colors links based on their type–crosslink, looplink, or monolink.
Search
When merging multiple searches (maximum of 3), this option colors links based on which search(es) they were found in. This allows for a quick, structure-based comparison of results between searches.
Render mode
Provides access to different rendering modes for the structure, itself. The options are:
Cartoon (default)
Provides a helix, strand coil cartoon view of the structure.
Smooth Line
Draws the structure as a smoothed line tracing consecutive alpha carbons..
Trace
Draws the structure as straight lines connecting consecutive alpha carbons.
Lines
Draws the struture at atomic resolution using lines for bonds.
Points
Draws the structure as point cloud of all atoms.
Filter Data
The data presented in the viewer may be filtered using the form at the top of the page and clicking “Update From Database”. The filtering options are:
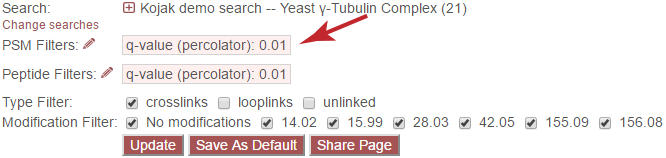
PSM Filters
The filters to apply at the PSM level. Only results which have at least one PSM that meets all of the selected critiera will be listed. When listing PSMs associated with peptides, only PSMs that meet all of the selected critiera will be listed.
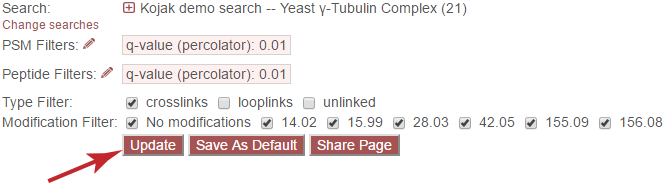
To change the PSM-level filters, first click the pencil icon next to “PSM Filters”:
This opens an overlay with the containing the possible score types to use as PSM filters for this search. To change the cutoff values to be used for any of these score types, enter the value next to the score type. proxl will correctly handle scores for which larger values are more significant or scores for which smaller values are more signiciant.
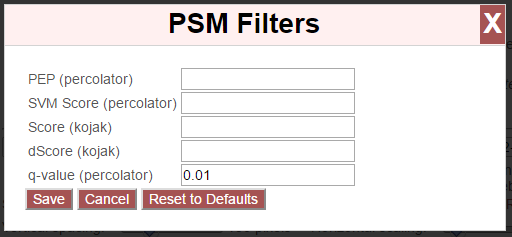
To save the new values to the page, click the “Save” button. To cancel, click “Cancel”.
The “Reset to Defaults” button will reset the cutoff values to the defaults specified by the proxl XML file uploaded to the database. This typically represents the suggested cutoffs by the author of the respective search program.
Important: It is necessary to update the data on the page after changing filter cutoff values. After clicking the “Save” button, you must click the “Update From Database” button on the page to apply any new PSM- or peptide-level filters.
Peptide Filters
The filters to apply at the peptide level. Only results which have at least one peptide that meets all of the selected critiera will be listed.
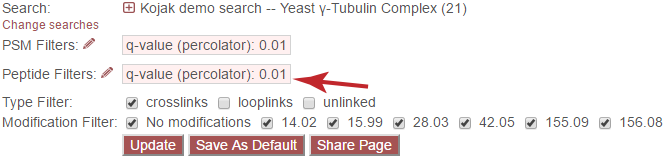
To change the peptide-level filters, first click the pencil icon next to “Peptide Filters”:
This opens an overlay with the containing the possible score types to use as peptide-level filters for this search. To change the cutoff values to be used for any of these score types, enter the value next to the score type. proxl will correctly handle scores for which larger values are more significant or scores for which smaller values are more signiciant.
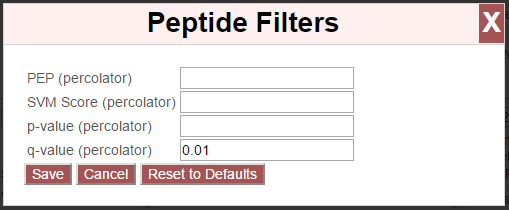
To save the new values to the page, click the “Save” button. To cancel, click “Cancel”.
The “Reset to Defaults” button will reset the cutoff values to the defaults specified by the proxl XML file uploaded to the database. This typically represents the suggested cutoffs by the author of the respective search program.
Important: It is necessary to update the data on the page after changing filter cutoff values. After clicking the “Save” button, you must click the “Update From Database” button on the page to apply any new PSM- or peptide-level filters.
Exclude links with
Links that exclusively have peptides with any of the checked attributes will not be shown. The attributes are:
- no unique peptides - If the link (crosslink, looplink, or monolink) was exclusively identified by peptides that also map to othe proteins
- only one PSM - If a given link was identified by a single PSM
- only one peptide - If a given link was identifed by a single peptide, where a peptide is the combination of sequence, linked positions, and modifications
Exclude proteins with
This option limits which proteins will appear in the pull-down menu for mapping proteins to PDB chains. Proteins that contain any of the checked options will not appear. For example, checking ‘No links’ prevents proteins that do not contain crosslinks, looplinks, or monolinks from appearing. This will also prevent any links involving excluded proteins from being drawn on the structure.
Exclude organisms
This options limits which proteins will appear in the pull-down menu for mapping proteins to PDB chains. No proteins from any of the checked organisms will appear. This will also prevent any links involving excluded proteins from being drawn on the structure.